
Vous pouvez lire le billet sur le blog La Minute pour plus d'informations sur les RSS !
Canaux
3756 éléments (11 non lus) dans 55 canaux
 Dans la presse
(1 non lus)
Dans la presse
(1 non lus)
-
 Décryptagéo, l'information géographique
-
Cybergeo
-
Revue Internationale de Géomatique (RIG)
-
SIGMAG & SIGTV.FR - Un autre regard sur la géomatique
(1 non lus)
-
Mappemonde
Du côté des éditeurs
(1 non lus)
-
Imagerie Géospatiale
-
Toute l’actualité des Geoservices de l'IGN
-
arcOrama, un blog sur les SIG, ceux d ESRI en particulier (1 non lus)
-
arcOpole - Actualités du Programme
-
Géoclip, le générateur d'observatoires cartographiques
-
Blog GEOCONCEPT FR
Toile géomatique francophone
(9 non lus)
-
Géoblogs (GeoRezo.net)
-
Conseil national de l'information géolocalisée
-
 Geotribu
(1 non lus)
Geotribu
(1 non lus) -
Les cafés géographiques
(2 non lus)
-
UrbaLine (le blog d'Aline sur l'urba, la géomatique, et l'habitat)
-
Icem7
-
Séries temporelles (CESBIO)
-
Datafoncier, données pour les territoires (Cerema)
-
Cartes et figures du monde
-
SIGEA: actualités des SIG pour l'enseignement agricole
-
Data and GIS tips
-
Neogeo Technologies
(2 non lus)
-
ReLucBlog
-
L'Atelier de Cartographie
-
My Geomatic
-
archeomatic (le blog d'un archéologue à l’INRAP)
-
Cartographies numériques
(4 non lus)
-
Veille cartographie
-
Makina Corpus
-
Oslandia
-
Camptocamp
-
Carnet (neo)cartographique
-
Le blog de Geomatys
-
GEOMATIQUE
-
Geomatick
-
CartONG (actualités)

blog
-
sur Camptocamp: Optimizing Trail Management: Mergin Maps for Greater Annecy
Publié: 19 July 2024, 2:00am CEST
Pièce jointe: [télécharger]
Grand Annecy turned to Camptocamp to find the tool best suited to their needs.
-
sur [Équipe Oslandia] Jean-Marie, développeur C++ / Python
Publié: 18 July 2024, 7:30am CEST par Caroline Chanlon
Jean-Marie a toujours aimé l’électronique et tout ce qui touche au traitement du signal. Il rejoint l’INSA Rennes, une école d’ingénieur généraliste en spécialité ESC – Electronique et Systèmes de Communication (aujourd’hui E&T) sur les problématiques télécommunications.
Il réalise son stage de fin d’étude chez Silicom à Rennes sur le sujet « Modélisation de systèmes de communication » sous Matlab avant d’être embauché par la même entreprise mais pour une toute autre mission …le développement d’une application informatique de simulation de réseaux télécom pour la DGA avec QT en C++ !
« Je ne connaissais pas trop l’informatique, quelques notions pendant mes études, mais j’aimais bien, ça me plaisait de pouvoir me lancer là dedans. J’ai acquis des connaissances en pratiquant, c’est comme ça qu’on apprend ! »
Ensuite, Jean-Marie saisit l’opportunité de travailler sur le passage au tout numérique via la TNT. « J’ai travaillé pendant 2 ans et demi au CSA, j’ai réalisé des études sur la planification de fréquences, étudié les couvertures des émetteurs TNT. C’était une super expérience, j’ai travaillé sur un projet qui a impacté les français au quotidien ! »
De retour à Rennes, il reprend le développement en C++ avec QT, notamment pour un projet d’analyse de signaux sismiques du CEA et découvre QGIS. Une nouvelle compétence qu’il mobilise pour la DGA et le développement d’un outil basé sur QGIS pour l’affichage de données relatives à l’aide à la planification de missions satellites.
« 14 ans chez Silicom, il était temps de passer à autre chose »
Jean-Marie rejoint Oslandia en novembre 2021 en tant que développeur C++ / Python où il réalise des missions de développement et DevOps, notamment pour Viamichelin sur la refonte du calcul d’itinéraire de l’outil en ligne ou pour l’IGN pour la mise en place du calcul d’itinéraire sur la nouvelle Géoplateforme.
Projet emblématiqueJean-Marie a produit 80% du code d’OpenLog, un outil de visualisation de données de sondage open source porté par Apeiron (filiale d’Oslandia).
« Ce projet m’a permis de mobiliser mes connaissances sur la représentation de données »
Technologies de prédilectionPython et C++
Ta philosophieLe partage ! Ce qu’on produit peut être utilisé par d’autres, nous partageons nos connaissances et notre travail !
Oslandia en 1 motOuverture par rapport à l’open source et dans le sens où tout est transparent dans l’entreprise, tout le monde peut donner son avis, les décisions sont prises collectivement.
-
sur SIG Libre Uruguay: Va una más…
Publié: 17 July 2024, 7:47pm CEST
-
sur gvSIG Batoví: edición 2024 del concurso: Proyectos de Geografía con estudiantes y gvSIG Batoví
Publié: 17 July 2024, 7:45pm CEST

Habiendo finalizado con éxito la etapa de capacitación de la iniciativa Geoalfabetización mediante la utilización de Tecnologías de la Información Geográfica, lanzamos la convocatoria a participar de la edición 2024 del concurso: Proyectos de Geografía con estudiantes y gvSIG Batoví. Organizan Ceibal, la Dirección Nacional de Topografía del Ministerio de Transporte y Obras Públicas (MTOP), la Inspección Nacional de Geografía y Geología de la Dirección General de Educación Secundaria (DGES), junto con la Universidad Politécnica de Madrid (UPM). Pueden acceder aquí a la convocatoria y bases.
Este año contamos con la colaboración de la Dirección General de Educación Técnica Profesional (DGETP), la Asociación Nacional de Profesores de Geografía (ANPG) y la Universidad Central “Marta Abreu” de Las Villas (Cuba).
Agradecemos el apoyo de todas las instituciones que hacen posible la realización de esta propuesta.
-
sur Mappery: The Cure for Anything is Salt Water
Publié: 17 July 2024, 11:00am CEST
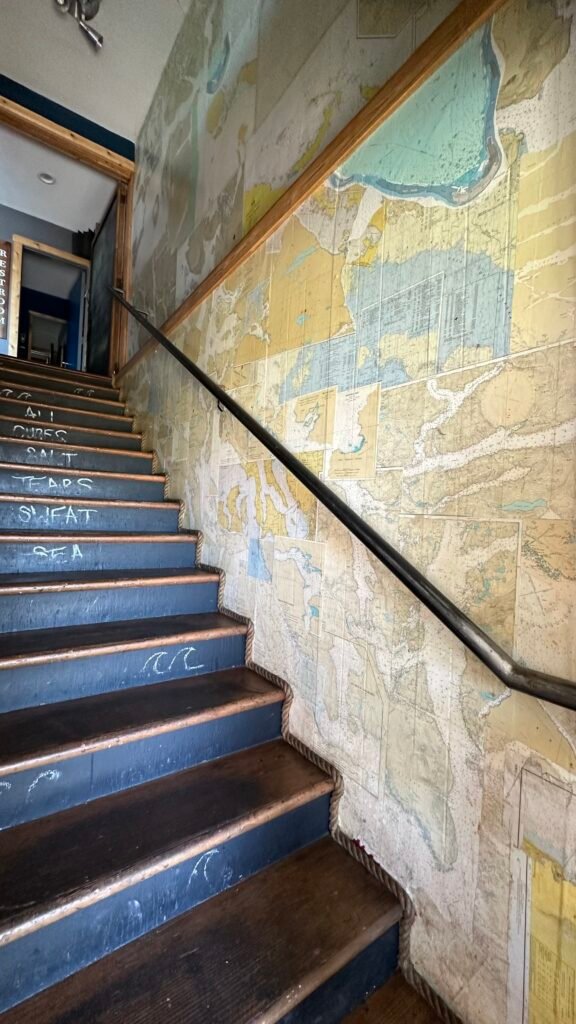
Darrell Fuhriman sent me these pics from the Salt Pub in Ilwaco, Washington.
“They decorated with old nautical charts, including a lamp shade and wallpaper on the stairs and entryway. “
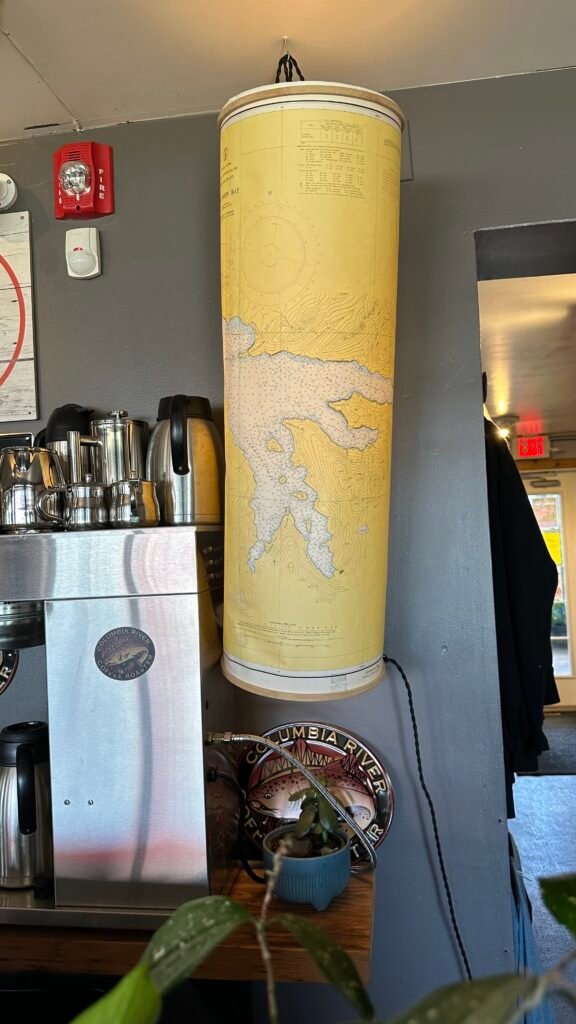
The stairs reference a quote by author Isak Dinesen. “The cure for anything is salt water — sweat, tears, or the sea.”
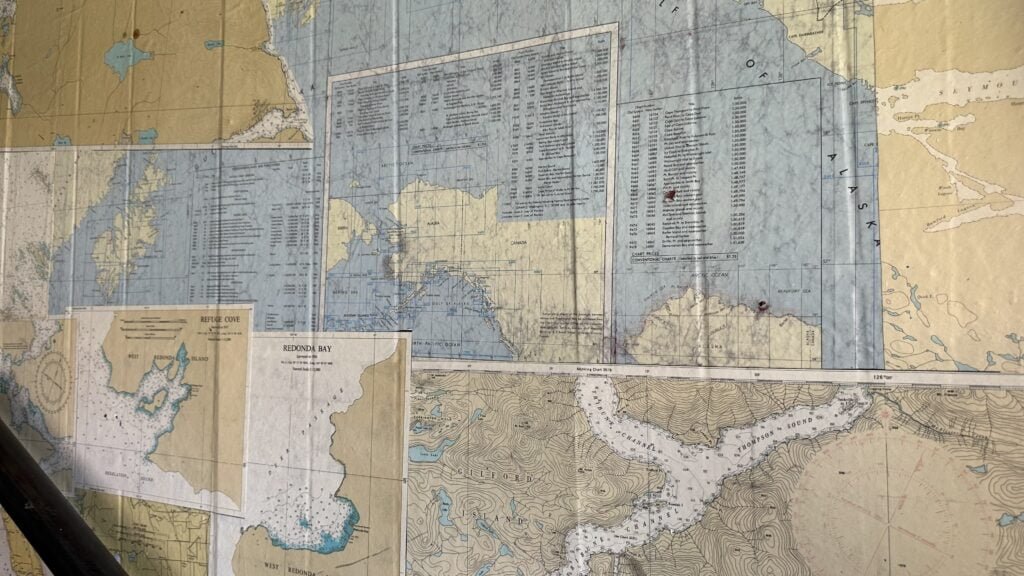
MapsintheWild The Cure for Anything is Salt Water
-
sur GeoSolutions: FOSS4G North America: GeoSolutions Sponsoring FOSS4GNA – Workshops, and Presentations
Publié: 16 July 2024, 2:34pm CEST
You must be logged into the site to view this content.
-
sur Mappery: Origin of the Species
Publié: 16 July 2024, 11:00am CEST
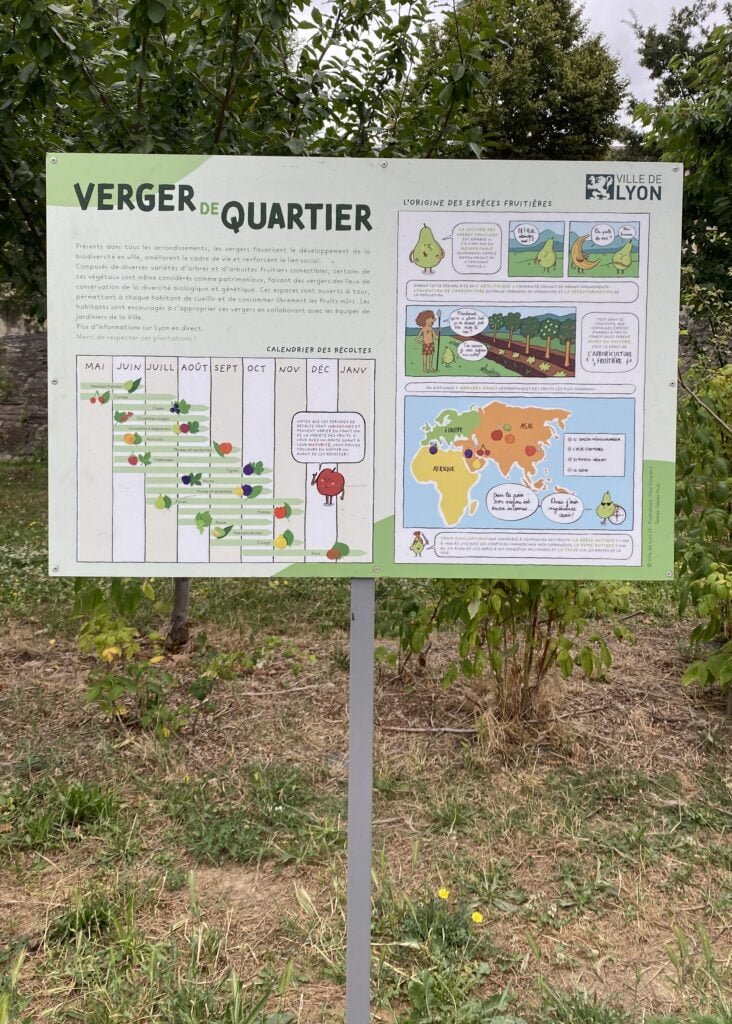
Reinder took this pic in a neighbourhood orchard “. along the river Saône in Lyon, named after a local heroine Mere Guy”
“In the 2nd arrondissement, the orchard created at Place Général Delfosse was named in honor of Mere Guy. A pioneer of the Meres de Lyon, she opened her restaurant in 1759 on the banks of the Rhône at Mulatière. She serves fish provided by her husband, a traditional fisherman, including her signature dish: eel matelote.” (Apologies for my translation)
[https:]The map shows the origins of the various species in the orchard
MapsintheWild Origin of the Species
-
sur Adam Steer: Mapping a small farm part 2: microhydrology
Publié: 16 July 2024, 7:10am CEST
This is the first sequel to Mapping a small farm part 1. To summarise the first story, it walks through flight planning and practice, then data processing to get some first cut products, and a bit of mapping to show ideas about how accurate we think the product is. The products we’re interested in now… Read More »Mapping a small farm part 2: microhydrology

-
sur TerriSTORY® – Une histoire de territoires OpenSource
Publié: 16 July 2024, 7:04am CEST par Sylvain Beorchia
Lorsque nous avons commencé à travailler sur Terristory en 2018, c’était alors un POC (Proof Of Concept) commandé par AURA-EE, Auvergne Rhône-Alpes Énergie Environnement. Le premier sprint devait convaincre de la faisabilité et projeter les ambitions de l’association. 6 ans plus tard, la plateforme devenue publique est un projet OpenSource maintenu de façon autonome directement par AURA-EE.
Le développement de la plateforme s’est déroulé sur plusieurs années. Au départ Oslandia était le prestataire chargé de réaliser et conseiller l’AURA-EE sur le projet, mais il était prévu aussi de former petit à petit les équipes côté association et de transmettre le savoir pour un jour permettre une totale autonomie. En parallèle, il y avait une volonté forte de la part d’Oslandia d’arriver à terme à une ouverture du code source de l’application, ce qui était également une volonté d’AURA-EE dès le départ.
Publier le code source d’une application (ici un site web) n’est pas forcément une tâche difficile en apparence. On pourrait penser qu’il s’agit juste de créer un répertoire gitlab et d’y déposer le code. Dans les faits, c’est ce qui se passe. Néanmoins, une bonne préparation en amont est nécessaire si on souhaite une ouverture de qualité.
De nombreuses questions se bousculent alorsQuand doit-on publier ? Est-ce que la documentation est prête ? Dois-je traduire en anglais ? A-t-on résolu tous les bugs critiques ? Comment va se passer la publicité ? Y-a-t il un formalisme à respecter ? Les aspects juridiques sont-ils couverts ? Est-on prêt à recevoir les retours de la communauté ?
Les étapesLa première chose à faire était de choisir la licence. Dans le cas de Terristory c’est la GNU Affero (ou AGPL) version 3 qui a été sélectionnée, après étude des tenants et des aboutissants. Ici il s’agit d’un outil serveur, sur lequel AURA-EE et les différents partenaires impliqués au sein d’un consortium national voulaient que les modifications faites par les utilisateurs soient reversées.
Un premier travail de documentation et de structuration du code a été entrepris par AURA-EE. Avoir une bonne documentation, des guidelines sont essentiels pour s’assurer que toute personne intéressée par la réutilisation ou par la contribution au code puisse aisément installer, tester et ajouter de nouvelles fonctionnalités.
Le code de Terristory a également connu de nombreuses phases de refactoring, c’est à dire de réécriture de certaines parties parce qu’obsolète, pas assez efficaces ou suite à des changements de librairies utilisées. Outre les évolutions fonctionnelle d’une telle application, le refactoring constitue une partie importante de la vie du logiciel. D’autant plus sur les applications Web où les avancées technologiques sont rapides. Il faut maintenir le code, et suivre l’évolution des librairies sous-jacentes si on veut pouvoir faire évoluer le site plus facilement et par un maximum de personnes. Côté Oslandia, nous anticipons au mieux ces phases de développement pour éviter le jour J de devoir faire une revue totale et potentiellement complexe du code juste avant la publication.
Oslandia a accompagné AURA-EE sur toutes ces années, et a réussi à lui transmettre la culture de l’OpenSource, aussi bien techniquement que dans les méthodes de travail. Ainsi, les collaborateurs d’AURA-EE sont vite devenus des utilisateurs experts de Gitlab, des utilisateurs experts de la solution, puis des développeurs de l’application, pour enfin procéder eux-même à la libération publique du code. En tant qu’ancien développeur principal de l’application pendant plusieurs années, je suis personnellement assez fier du travail accompli et de la manière dont les choses se sont déroulées.
[Témoignage]Pierrick Yalamas, Directeur intelligence territoriale et observatoires à Auvergne-Rhône-Alpes Énergie Environnement :
Notre vision
« Oslandia a su nous accompagner durant les premières années du projet TerriSTORY® : des premiers développements à l’appui juridique (choix de la licence) pour l’ouverture du code. L’équipe est maintenant complètement autonome. L’ouverture du code début 2023 a déjà donné lieu (mi-2024) à plusieurs réutilisations, qui permettent d’enrichir les fonctionnalités de TerriSTORY®. »Le projet TerriSTORY® et la manière dont il s’est déroulé correspond à la vision d’Oslandia de la relation client : notre objectif est de fournir les outils et les méthodes permettant aux organisations que nous accompagnons d’être le plus efficace et le plus autonome possible. Et ce, sur tous les aspects d’un projet logiciel : technique, mais aussi organisationnel, juridique, sur l’infrastructure de développement et les process mis en place. Voir des solutions que nous avons ébauchées prendre leur propre autonomie, dans le respect de l’esprit du logiciel libre est une satisfaction et une fierté pour toute l’équipe, et nous sommes reconnaissants à l’AURA-EE de nous avoir fait confiance pour cela.
-
sur Ian Turton's Blog: Adding a spell check to QGIS
Publié: 16 July 2024, 2:00am CEST
Adding a Spell Check to QGIS(Or what to do on a rainy bank holiday in Glasgow)
This Monday was a local bank holiday in Glasgow (or at least the university) as a remnant of when the whole town took a train to Blackpool in the same two weeks so that the ship builders and steel works could stop in a coordinated fashion. As is required in the UK the weather was awful so I stayed in and being bored looked at my long list of possible projects. I picked one that has been kicking around on the list for a while adding a spell checker for QGIS. As a dyslexic I have spell checking turned on in nearly every program I enter text into including
vim,InteliJand my browser. So I have always felt that what QGIS really needed was a way to spell check maps before I printed them at A3 and put them on the wall.Back in 2019 North Road wrote a iblog post about custom layout checks and ended it with a throw away comment “It’d even be possible to hook into one of the available Python spell checking libraries to write a spelling check!”. I came across this when I was trying to see if there was an easy way for my students (many of whom have English as a second language) to avoid handing in projects with glaring (i.e. I can see them) spelling errors in the title. So I stuck the link on my backlog, until the proverbial rainy day came along.
ImplementationObviously I’m the last person who should be allowed to write spell checking software, but the joy of open source is that for things like this someone else has almost certainly already done it. So a quick duck-duck-go found me installing
pyspellcheckwhich seemed like it would do what I want. It has a pretty easy interface in that once you’ve created a spell checker object, you can just pass in a list of words and it will return a list of (probably) misspelled words and a method to give the most likely correction and another method to give you list of other possibilities. Armed with this I could create a method to find and check all the text elements of a print layout.@check.register(type=QgsAbstractValidityCheck.TypeLayoutCheck) def layout_check_spelling(context, feedback): layout = context.layout results = [] checker = SpellChecker() for i in layout.items(): if isinstance(i, QgsLayoutItemLabel): text = i.currentText() tokens = [word.strip(string.punctuation) for word in text.split()] misspelled = checker.unknown(tokens) for word in misspelled: res = QgsValidityCheckResult() res.type = QgsValidityCheckResult.Warning res.title = 'Spelling Error?' template = f""" <strong>'{word}</strong>' may be misspelled, would '<strong>{checker.correction(word)}</strong>' be a better choice? """ possibles = checker.candidates(word) if len(possibles) > 1: template += """ Or one of:<br/> <ul> """ for t in possibles: template += f"<li>{t}</li>\n" template += '</ul>' res.detailedDescription = template results.append(res) return resultsAnd in theory, that was that! But I’m pretty sure that my students (and everyone else) probably didn’t want to cut and paste that into the console every time they wanted to spell check a map. So, I looked at how to package this up for QGIS. I built a plugin (using the plugin builder tool), but then things got a little tricky as I can’t see any way for a plugin to add itself to the print layout rather than the main QGIS window (please let me know if it is possible), and it seemed unintuitive to make people press a button in one window to effect another one, besides the whole point of being a
QgsAbstractValidityCheckwas that the method is automatically run on print. So I didn’t need most of the plugin code or did I? On further thought I did, there is a need for some GUI as the user can pick which language they want to use in the spell check.pyspellcheckcan spell check English, Spanish, French, Portuguese, German, Italian, Russian, Arabic, Basque, Latvian and Dutch (so if those are your language then please test this for me). I also thought that providing the option to supply a different to the default personal dictionary might be useful. So that made use of the dialog that pops up when you hit the plugin.But it turns out you can’t register a class method as as a
QgsAbstractValidityChecksince it gets confused when QGIS calls it later. So I had to move my checker method outside the plugin class. But then I couldn’t access the language and dictionary that was set in the GUI! Some more searching gave me the following code:_instance = plugins['qgis-spellcheck'] checker = _instance.checkerWhereby I can pull out the named plugin and grab it’s spell checker, which was created in the plugin’s
Future Work__init__method. I seem to have a small issue that the user’s profile is not set when that runs which messes up where the personal dictionary is put (again if you know how to fix this let me know).Ideally, I’d like the spell checker to scan and highlight the text in the boxes as I typed but I fear that is beyond my understanding of the QGIS/Qt interface. Next highest on my wish list is for the list of spelling issues to be non-modal so I can cut and paste fixes into the text box, rather than having to memorise the correct spelling, close the window and then type it in (again answers on a github issue).
I’m sure all sorts of things will come up once people start using it, so as usual issues and PRs are welcome at [https:]
-
sur Mappery: Mitchell Library, Sydney
Publié: 15 July 2024, 11:00am CEST
Another one from Anna Barca
“From the map room in First floor in the Mitchell Library building in the State Library of Sydney. I love looking at those historical art works and think about how maps were made in “the old days” and what was then the focus of the drawings.” (Me too!)
MapsintheWild Mitchell Library, Sydney
-
sur QGIS Blog: Plugin Update – June, 2024
Publié: 14 July 2024, 8:46pm CEST
In the month of June, 23 new plugins were published in the QGIS plugin repository.
Here follows the quick overview in reverse chronological order. If any of the names or short descriptions catches your attention, you can find the direct link to the plugin page in the table below:
Heritage Inventory Digitally register, manage, and visualise heritage resource data with this inventory worksheet plugin. Commuting Analysis This plugin analysis and visualises commuting data. Supervised Classifier A plugin to classify selected raster file with reference Field Stats This plugin calculates basic stats, graph histogram and boxplot Curvilinear Coordinator Plugin for river data conversion from Cartesian to curvilinear orthogonal system Konwerter PL-ETRF2000 PL-2000 Konwerter wspó?rz?dnych punktu uk?adu PL-ETRF2000 do uk?adu PL-2000 EIS QGIS Plugin Comprehensive mineral prospectivity mapping and analysis framework mgwr_plugin A QGIS plugin for Multiscale Geographically Weighted Regression (MGWR) D2S Browser This plugin allows you to browse your data on a D2S instance. WAsP scripting Scripts for fetching, creating and saving WAsP map files CSMap Plugin DEM?GeoTIFF???CS????????QGIS???????? Fast Line Density Analysis A fast line density visualization plugin for geospatial analytics Unsupervised Classifier Plugin for unsupervised classification of satellite images BathyFlowDEM Anisotropic interpolation for bathymetric data Hankaku Converter This plug-in converts string attribute values to full-width (Zenkaku) and half-width (Hankaku) characters to each other. Spot Height Extractor This plugin extracts spot heights from an elevation model. Power Clipboard Plugin to easy copy/zoom to XY/YX coords. Pan Europeo Ponders very large and distinct rasters with different utility functions trainminator2 Plugin de labellisation ?????(DigitalTwin) QGIS plugin for DigitalTwin Band Stacker A plugin to stack bands from selected raster layers Georeferencer Extension Extension to the Raster Georeferencer Plugin CartoGrapher This plugin provides commonly used methods to produce a generalized map. -
sur Mappery: Explosion de la Liberté
Publié: 14 July 2024, 11:00am CEST
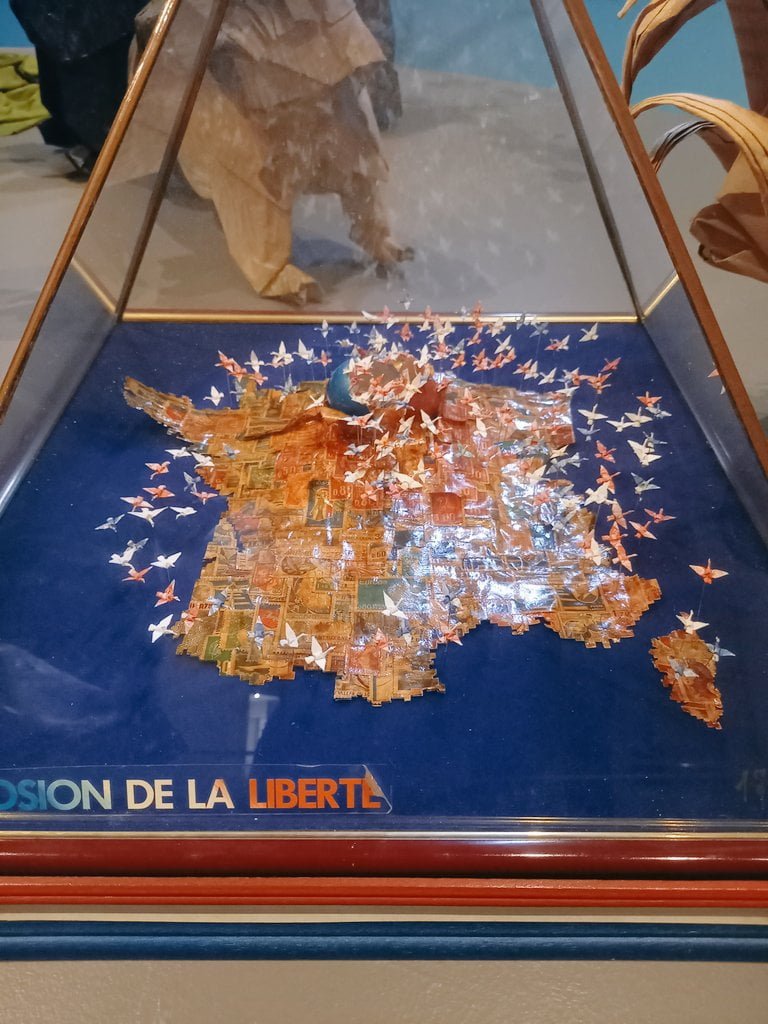
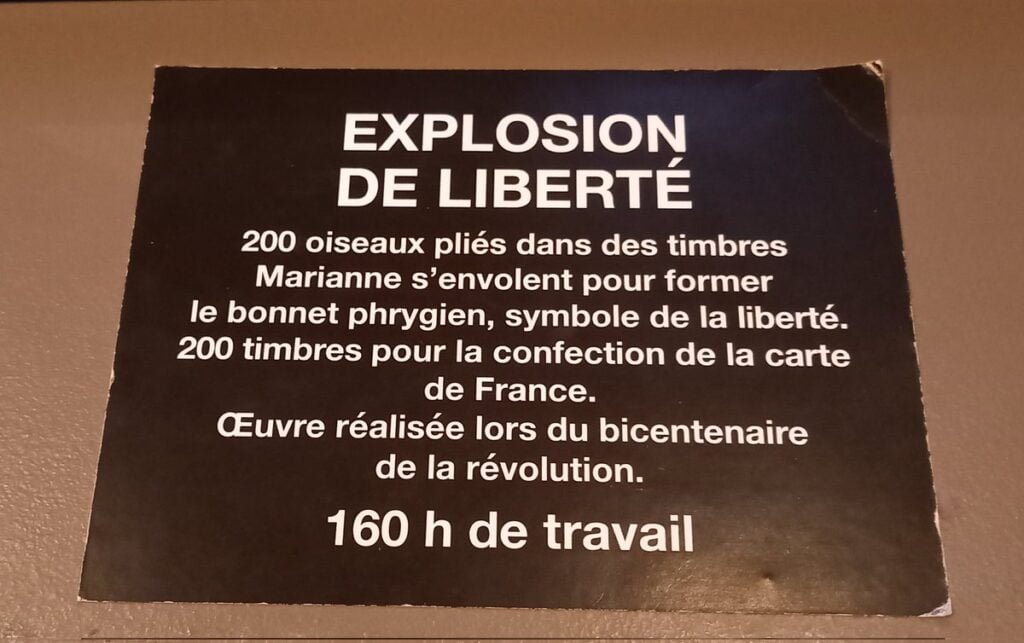
Anne L. shared these pictures last year. What could be better to celebrate Bastille Day this year? The Liberty Explosion is made with 200 stamps representing Marianne, the Symbol of the French Revolution for the Liberty, and the explosion takes the shape of the Phrygian cap.
Happy Bastille Day!
MapsintheWild Explosion de la Liberté
-
sur Mappery: How goes the World?
Publié: 13 July 2024, 11:00am CEST
Reinder spotted this atlas in a bookshop in Lyon, “saw this Asia-Australia centered atlas cover in Librairie Passages, in Lyon, France.”
Centering the world map on Asia and Australia (which places the Americas to the east) reminds us thatthe adoption of the Prime Meridian through Greenwich was a choice by European cartographers not some inalienable geographic rule.
MapsintheWild How goes the World?
-
sur KAN T&IT Blog: IOT Solution Congress en Brasil, nuestra experiencia
Publié: 12 July 2024, 7:35pm CEST
El pasado mes de junio se llevó a cabo el IOT Solutions Congress en la ciudad de San Pablo, Brasil, donde más de 5.000 personas se reunieron para ver las soluciones más avanzadas en la industria del Internet de las Cosas (IOT).
El Internet de las Cosas es un concepto tecnológico que se resume como una red de dispositivos interconectados, ya sea a través de internet u otro tipo de redes, con el fin de enviar y recibir información en tiempo real y de forma automatizada.
Como muchas tecnologías innovadoras, el IOT tiene una amplia variedad de aplicaciones y usos, y esto se vió reflejado en la diversidad de las empresas que se acercaron al evento de San Pablo para conocer más sobre el tema. Se destacó la presencia de empresas de la industria petroquímica, minera, agrícola, de la construcción y organismos gubernamentales.
En esta ocasión KAN participó del evento con un stand y con un espacio en el Startup Stage, donde Ariel Anthieni (CEO) dió una charla sobre las aplicaciones y beneficios de los Gemelos Digitales (Digital Twins) con un enfoque particular en el monitoreo de tránsito de las ciudades.
Un Gemelo Digital es una réplica digital altamente precisa de objetos de todo tipo, desde vehículos y turbinas hasta ciudades enteras, cuyo fin es el de crear simulaciones que puedan optimizar el uso de dichos objetos. El mayor valor que otorga un Gemelo Digital es que utiliza datos reales para llevar a cabo estas simulaciones.
Primero se recolectan los datos utilizando dispositivos de telemetría IOT (sensores térmicos, caudalímetros, acelerómetros, etc.), luego se procesa esta información y finalmente se vuelca sobre el modelo virtual. Utilizando este modelo se pueden realizar diferentes tipos de simulaciones, analizar cada uno de los distintos escenarios y buscar mejoras para optimizar los recursos que se disponen.
Por ejemplo, utilizando sensores de vibración y un gemelo digital, se puede analizar el uso real de una bomba de agua, simular distintos escenarios y establecer cuándo debe hacerse el mantenimiento preventivo óptimo según los datos obtenidos.
Para el caso de las ciudades, Ariel explicó en su charla que los Gemelos Digitales permiten ayudar a los organismos gubernamentales a ver de forma anticipada el impacto que determinadas políticas públicas pueden tener en la organización de la ciudad.
Ariel lo explica en dos ejemplos sencillos: Conociendo el movimiento real de los colectivos en las ciudades, se puede simular el impacto que tendrán en sus recorridos si una avenida principal es clausurada completamente. Esto permite al gobierno buscar la reorganización óptima y desplegar eficazmente a los equipos de tránsito que llevarán a cabo la tarea.
Otro ejemplo se ve en la ciudad de Japón, donde el gobierno utiliza Gemelos Digitales para realizar simulaciones de terremotos y tsunamis para mejorar su capacidad de respuesta y recuperación ante los desastres naturales.
En conclusión, KAN cumplió con su cometido en el congreso de IOT logrando mostrar una solución vanguardista dentro de la industria IOT y dejando en claro que es una de las startups a seguir.
-
sur Free and Open Source GIS Ramblings: Trajectools 2.2 released
Publié: 12 July 2024, 7:23pm CEST

If you downloaded Trajectools 2.1 and ran into troubles due to the introduced scikit-mobility and gtfs_functions dependencies, please update to Trajectools 2.2.
This new version makes it easier to set up Trajectools since MovingPandas is pip-installable on most systems nowadays and scikit-mobility and gtfs_functions are now truly optional dependencies. If you don’t install them, you simply will not see the extra algorithms they add:

If you encounter any other issues with Trajectools or have questions regarding its usage, please let me know in the Trajectools Discussions on Github.
-
sur WhereGroup: Volumendifferenzen, Zonenstatistik und mehr: wie Geoinformationssysteme (GIS) beim Wiederaufbau des Ahrtals helfen
Publié: 12 July 2024, 1:47pm CEST
Geoinformationssysteme unterstützen beim Wiederaufbau im Ahrtal nach der katastrophalen Flutkatastrophe 2021. Mit QGIS machen wir Daten sichtbar für diese Herkulesaufgabe, um Maßnahmen für den Wiederaufbau abzuleiten. -
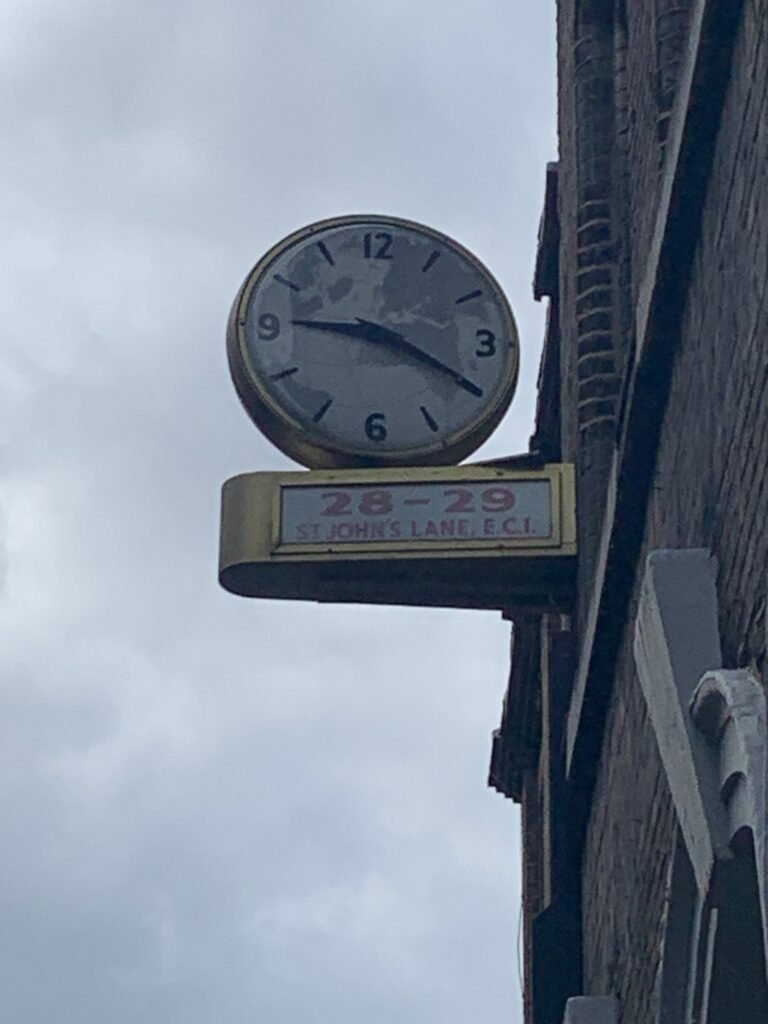
sur Mappery: World Time in EC1
Publié: 12 July 2024, 11:00am CEST
-
sur gvSIG Team: Acceptance Speech for the National Geographic Science Award
Publié: 12 July 2024, 8:17am CEST
Honorable Mr. Jesús Gómez, Undersecretary of Transport and Sustainable Mobility, distinguished authorities, ladies and gentlemen,
It is an immense honor and a profound satisfaction for me to receive, on behalf of the gvSIG Association, the first National Geographic Science Award ever given in Spain. We humbly confess that being the first to receive it, with so many deserving individuals and entities, further elevates the importance we place on this award. Additionally, it ensures that you will hear the best acceptance speech for the award to date.
This award represents an extraordinary recognition of the trajectory and dedication of a group passionate about geography, technology, and knowledge, understood as drivers of change.
Let us begin with the term that names this award, geography. Tim Marshall, in his excellent essay “Prisoners of Geography,” concluded that while geography does not dictate the development of all events, since great ideas and leaders are part of the push and pull of history, all must act within the confines that geography sets. Former U.S. President Barack Obama told us that geography was much more than putting names on a map; it was about understanding reality. Those who have listened to us over the years well know that in the gvSIG Association, we have always affirmed that reality manifests in the territory. Everything exists to the extent that it is in a place and how it relates to what is around it. Therefore, the geographic or spatial dimension of things is a fundamental attribute for managing reality. It was in the past, it will be in the future, and undoubtedly, it is in the present.
This leads us to talk about the second concept that excites us, technology. With more than two decades into the 21st century, we must all be aware that technology permeates every productive, economic, academic, and social process to the point of becoming an indispensable tool. Without fear of being wrong, I could say that there are more technological devices in this room than people. We cannot imagine that management of reality we spoke of without technology. We know that Spain and the European Union are significantly betting on science, technology, and innovation as fundamental pillars for their growth and sustainable development. For our part, in the gvSIG Association, we have always talked about technology as a strategic sector and will continue to insist on it as long as necessary. Geographic information management technologies, encompassed under the concept of geomatics, are those that allow us to analyze, understand, and manage the territory, geography.
Geomatics is applied in managing infrastructures of all kinds, in sectors such as the environment, security, energy, mobility, education, health, agriculture, tourism,… it is transversal to countless themes and applicable to countless geographies.
Thus, we should begin to be aware that being dependent on a strategic sector is a manifest weakness. Who would want our administrations, our universities, our companies, those that work in and with the territory, to be technologically dependent? Herein lies much of the importance and success of the gvSIG project: building and developing technologies for managing spatial data, its geographic dimension, with free software. Betting on technological sovereignty by promoting solutions that grant all rights and freedoms to their users. That avoid any dependence not only on technologies but on the owners of these. Not only that, the gvSIG Association has fostered its own industrial fabric, specialized in geomatics, making the Valencian Community and Spain a reference center internationally. Today, not only are gvSIG-branded technologies used worldwide, but today, Spanish companies carry out some of the largest projects related to geographic information systems around the globe. I conclude this section by reaffirming that betting on our own and free technologies can be, undoubtedly is, a strategic decision of the highest order.
We link this to the last concept related to the gvSIG Association’s activity, knowledge. And at this point, it might be worthwhile to take a look back at the history of our entity.
Let us not forget that if we are here today, receiving this important recognition, it is because one day a public administration, the Generalitat Valenciana, decided to take the first step. The gvSIG project came to light in 2004, with a first version of a software product that today is part of a complete catalog of geomatics solutions. Today, not only is it talked about, but legislation in Spain and Europe promotes reuse, sharing, interoperability among administrations, and the development of our own technologies. At the beginning of this century, it was not so. The Generalitat Valenciana not only took the first step but knew how to share the achievements with the entire international community and energize what would end up being the gvSIG Association.
Today, it continues to bet on the project, using gvSIG technologies in more and more areas, from agriculture to road safety, from industry to sustainable mobility, contributing to its development and also reusing all the technological improvements that are continuously consolidated in the project. Just last week, the Danish Agency for Digital Government published a report highlighting the Generalitat Valenciana as the main success case for the promotion of free software technology by a public administration. It spoke of gvSIG.
Therefore, this award, this recognition, is largely shared with the Generalitat Valenciana and, in particular, with its Directorate General of Information and Communication Technologies.
At the end of 2009, the gvSIG Association was born. A group of people, companies, and entities decided to scale the impact of the project. To ensure its sustainability on the one hand, to consolidate an incipient industrial fabric on the other. The premise might seem simple, but it was not easy to implement. Bringing the values of free software to the economy. Developing a new business model – a concept much talked about – based on collaboration, shared knowledge versus speculation with acquired knowledge, solidarity versus rivalry. From the dates, you may guess that we were born in the midst of a crisis, in difficult times, with few resources but with great enthusiasm. In those early years, we made the English proverb “A smooth sea never made a skilled sailor” our own. It was necessary to dream, and believing in our dreams has brought us here. After this time, we do not forget to keep dreaming.
Today, in 2024, the gvSIG Association is an entity recognized worldwide. The technology derived from a project born, let us not forget, on the periphery of Europe is used in more than 160 countries. We participate and collaborate with the main forums and organizations that promote Geographic Sciences, open knowledge, and interoperability. We have received international awards from entities such as NASA or the European Commission, which last year recognized gvSIG as the most important free software project in Europe. We have developed a suite or catalog of free technologies that allow addressing any need for information management with a geographic dimension, for any organization. We collaborate on R+D+I projects with dozens of universities, scientific publications citing the use of gvSIG are multiplying. gvSIG’s social networks have a notable influence with thousands of followers. And regarding that new business model we talked about… we have promoted the consolidation of Spanish companies and developed projects in more than 30 countries for entities of all kinds, from the United Nations to small municipalities, from large private sector energy companies to NGOs. We are, in short, an international reference center.
Our history, therefore, pivots around knowledge. Developing it to share it, to reduce asymmetries between territories, to generate quality economy, to reaffirm Antonio Machado’s saying that “in matters of culture and knowledge, you only lose what you keep; you only gain what you give.”
I want to recall an anecdote that well reflects this phrase. An example of those other values, not quantifiable, that occur around the model of knowledge, development, and business we promote in the gvSIG Association.
At an event organized by Itaipú Binacional in Foz do Iguaçu, Brazil, we were invited to give training courses both to the staff of the hydroelectric plant and, openly, to university students who wanted to attend. In the first training course, a male and a female student sitting in the front row asked the trainer (in this case, it was me) if he could put them in touch with the event organizers to ask for affordable accommodation. Then they told me their story…
At the University of Asunción, Paraguay, where they were studying, the students collectively requested the faculty to give them training in gvSIG, as they considered it a strategic investment for the country to have engineers trained in free software technologies, with all the advantages that entails. The faculty, familiar only with non-free products, refused. Among all the students, it was decided to collect funds to allow one male and one female student to make the long journey to Foz do Iguaçu, receive training, and thus, upon returning, be able to replicate the training for all the students. Today, several of those students hold responsible positions in the country.
If we have come this far, it is because many people think there can be other approaches, other ways of doing things. Therefore, to conclude, I want to thank all the people who were, are, or will be in the gvSIG project: workers, entities, communities… and especially to the colleagues for their effort and commitment, who have always put themselves at the service of the project and never put the project at their service. Our future will be full of maps, standards, algorithms, and lines of code, but above all, of people working towards a common goal. Thank you very much.
-
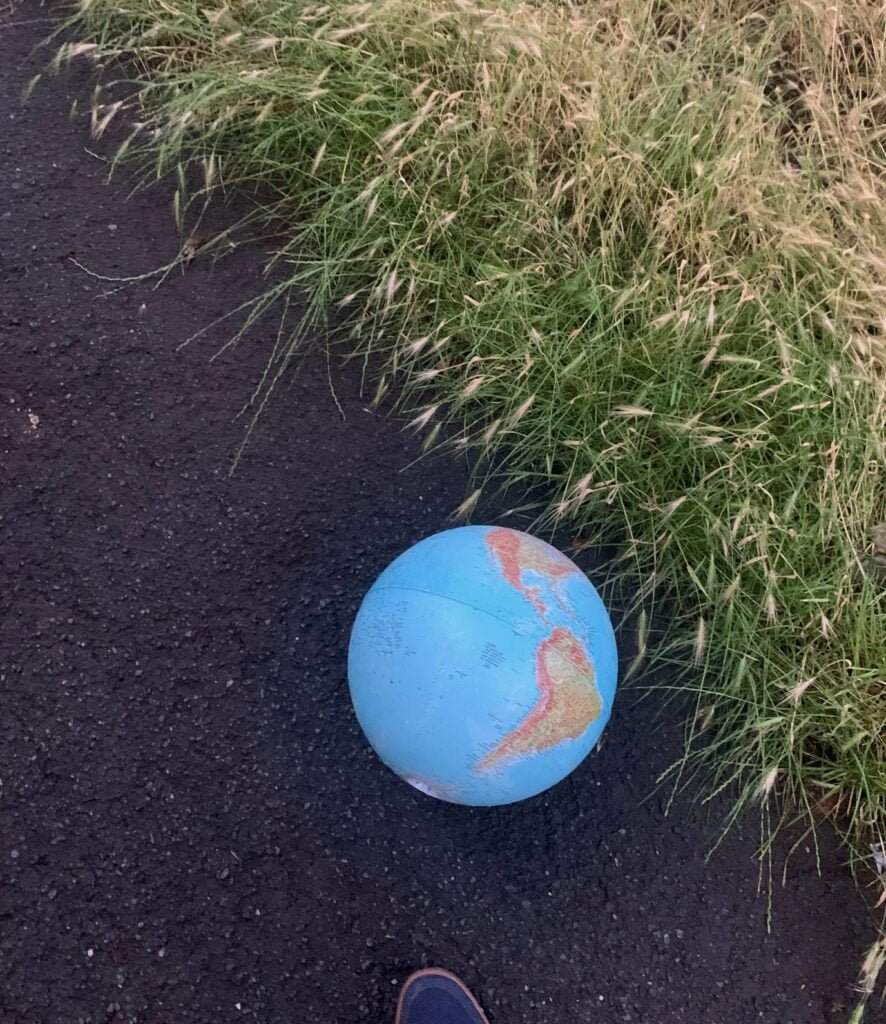
sur Mappery: Globes holding stuff in place
Publié: 11 July 2024, 11:00am CEST
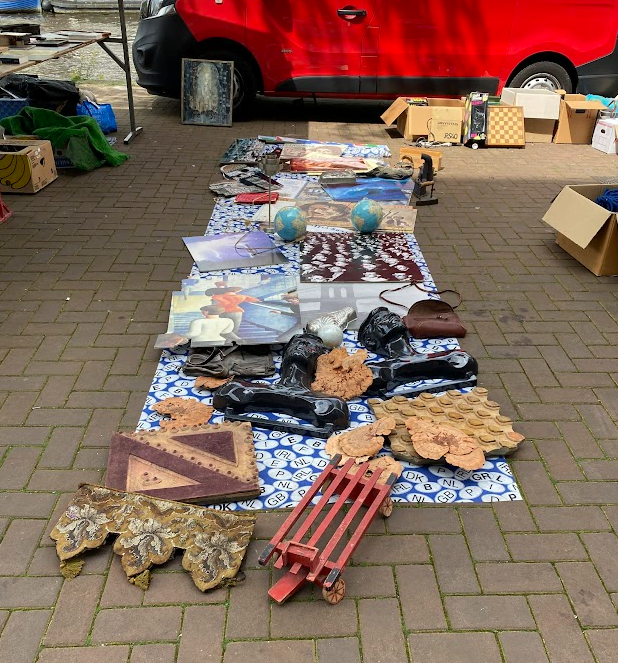
From Reinder, he spotted “Two globes at Waterlooplein-market in Amsterdam preventing the wind from blowing all the stuff away.”
MapsintheWild Globes holding stuff in place
-
sur Mappery: Fantasy Islands on Forest Bikes
Publié: 10 July 2024, 11:00am CEST
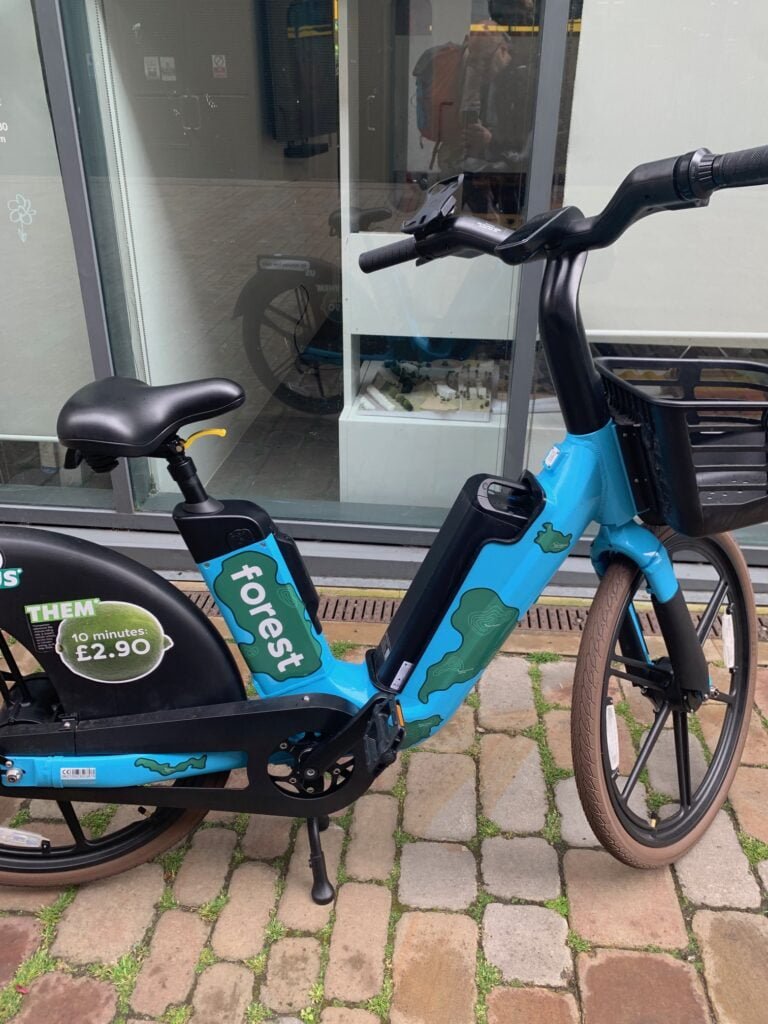
Marc-Tobias sent me these pics from his recent visit to London. Forest Bikes is a newish e-bike rental scheme in London. The bikes seem to be decorated with maps. Could they be real places, or is it a fantasy?
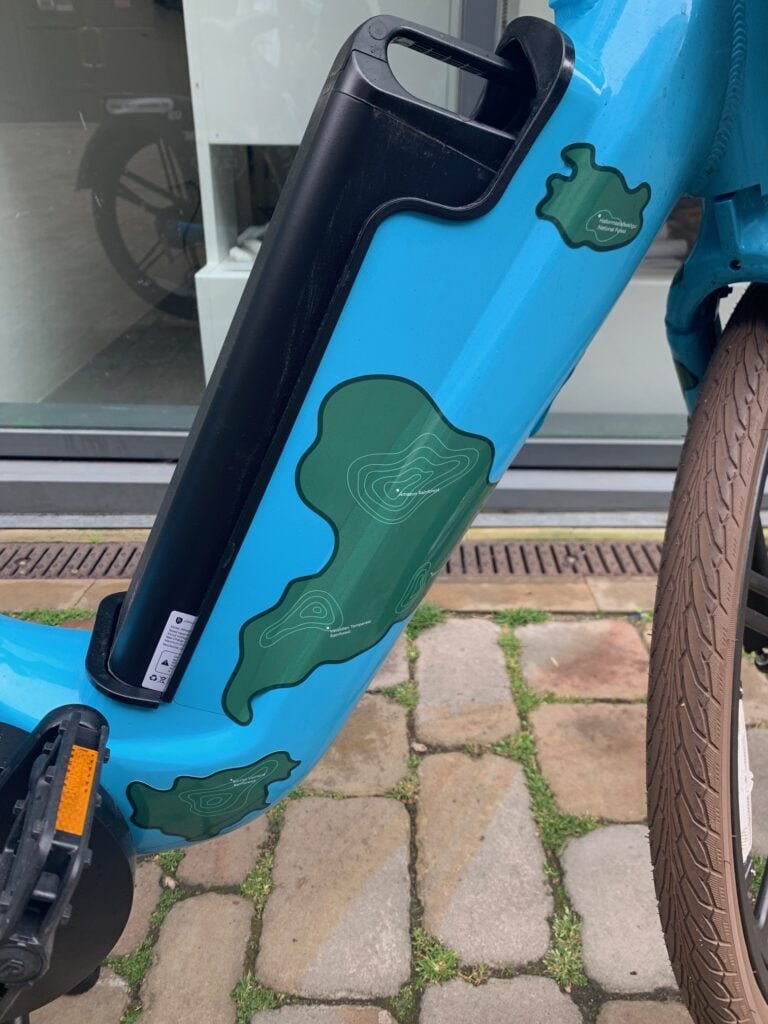
Note the contour lines
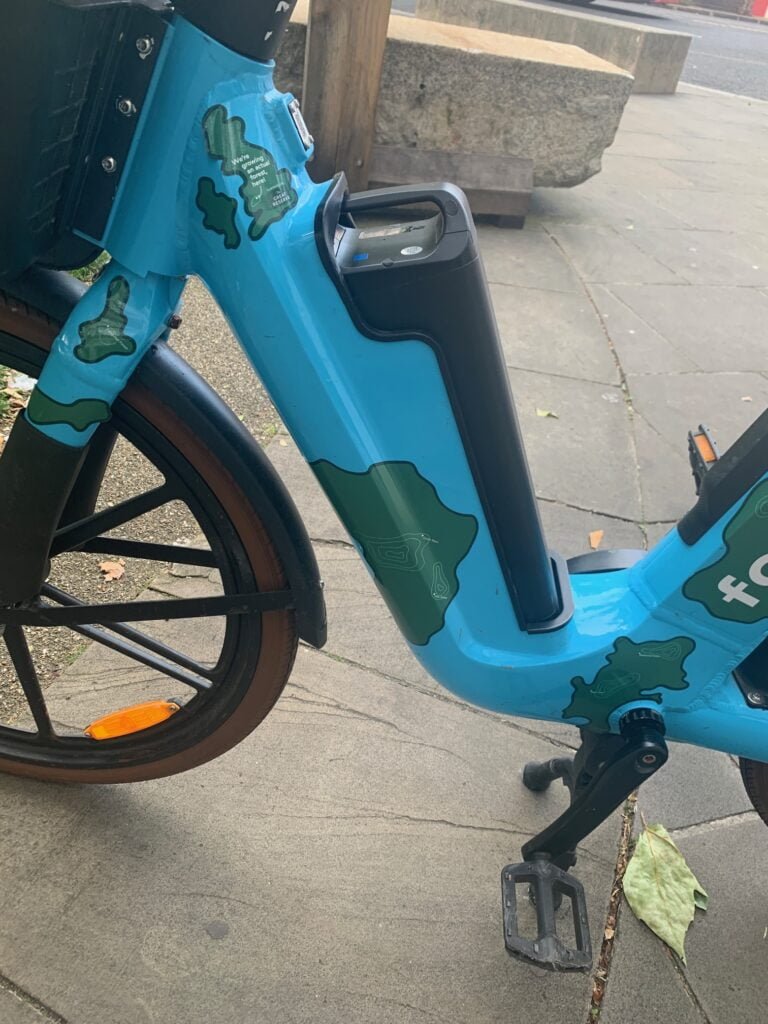
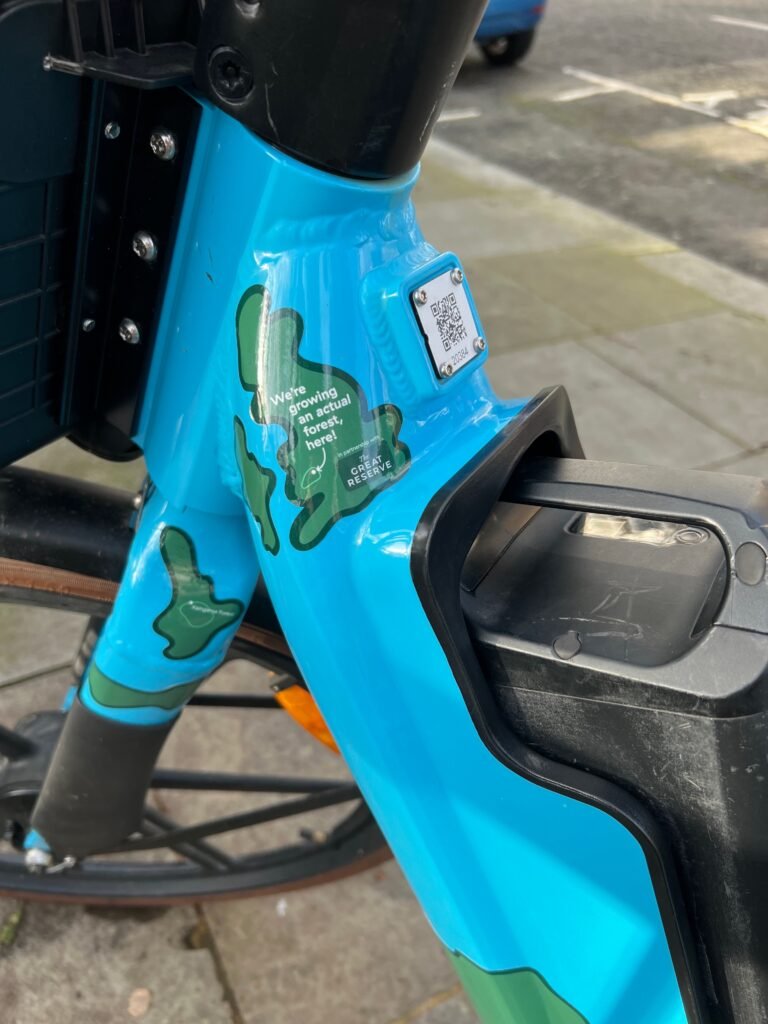
That is almost certainly the British Isles just below the handlebars.
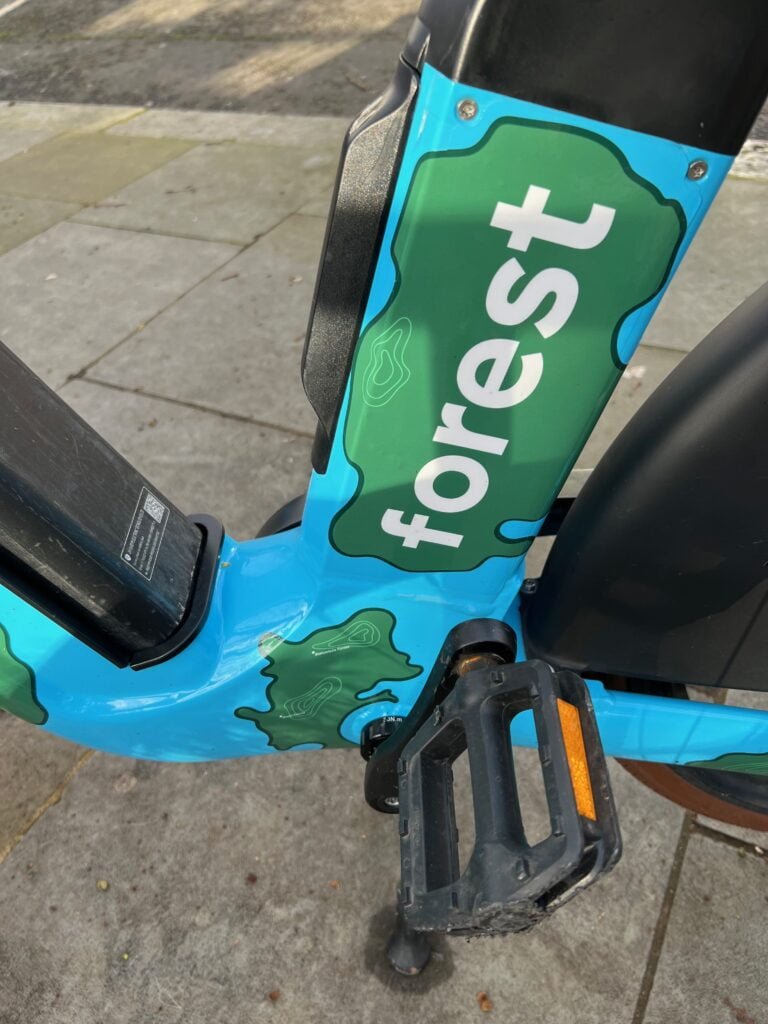
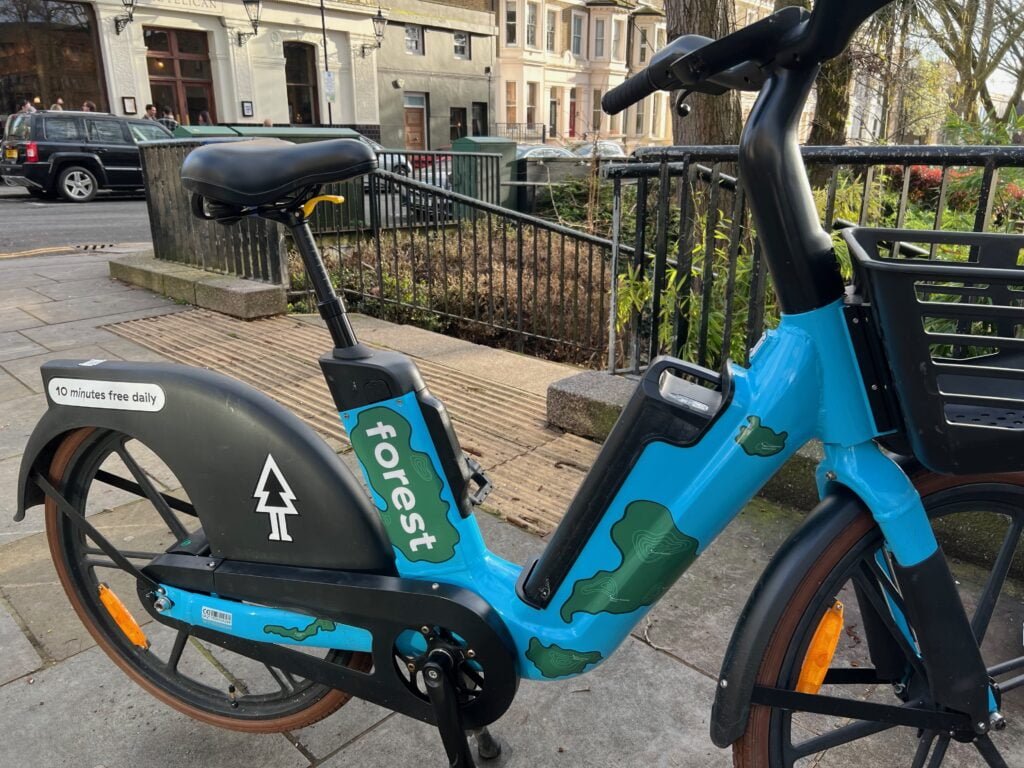
If anyone from Forest Bikes wants to comment…
MapsintheWild Fantasy Islands on Forest Bikes
-
sur GeoSolutions: GeoSolutions at geOcom 2024
Publié: 9 July 2024, 2:39pm CEST
You must be logged into the site to view this content.
-
sur Mappery: The Australian Bar
Publié: 9 July 2024, 11:00am CEST
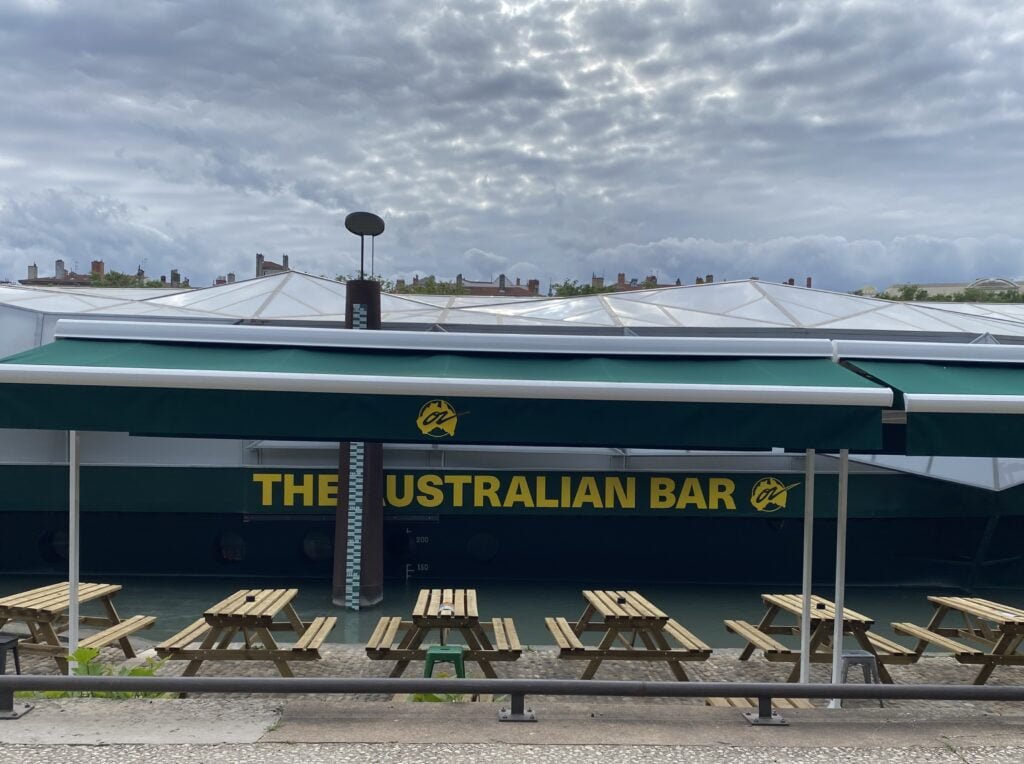
Reinder sent this. You might think this is from Australia but no, it is afloat on the River Rhone. You might also be wondering why it gets featured on Mappery, well look at the zoomed in image.
MapsintheWild The Australian Bar
-
sur Mapgears: Recap from the 56th International Snowmobile Congress
Publié: 8 July 2024, 2:32pm CEST
We once again attended the 56th edition of the International Snowmobile Congress, held this year in the picturesque state of Wisconsin. It was a great opportunity to engage with key figures in our industry.
As Bronze Sponsors, we reinforced our commitment to the snowmobiling community. Throughout the congress, we had meaningful face-to-face discussions with clients and explored potential partnerships with new associations interested in joining the evTrails family.
These events are always a highlight for us, enabling us to not only network within the industry but also to gain valuable insights into the needs and preferences of trail managers, particularly regarding smart mapping and related technologies.
We were thrilled to receive positive feedback from many clients who visited our booth, expressing their appreciation for our trail system and how it simplifies their daily responsibilities as trail managers. Additionally, we showcased our latest feature, Drive Up, which enhances the rider’s navigation experience through seamless driving mode integration.
The congress also provided us with invaluable client feedback on potential enhancements to our app and solutions. We returned home inspired by numerous ideas for new features that we are eager to develop and share with you.
Meanwhile, enjoy these photos of our team participating in the diverse activities at the 56th International Snowmobile Congress!
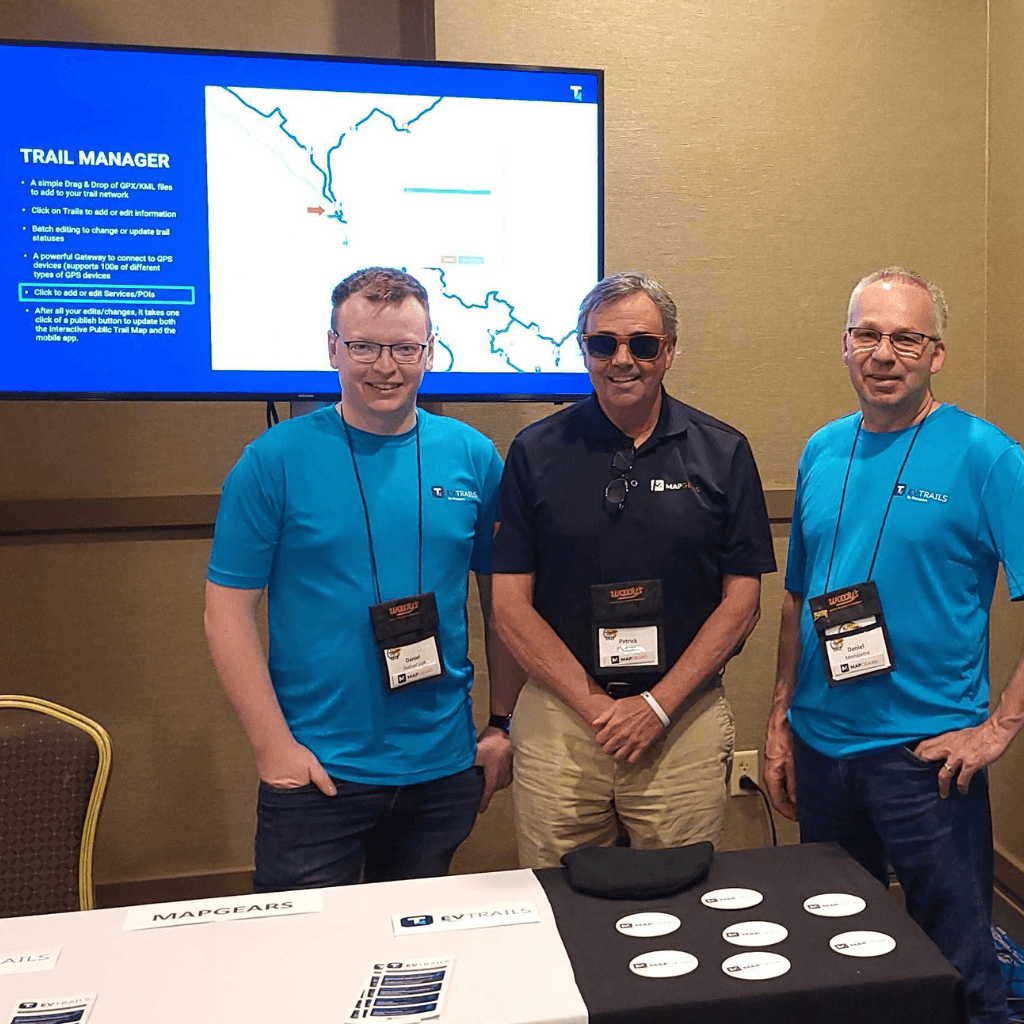

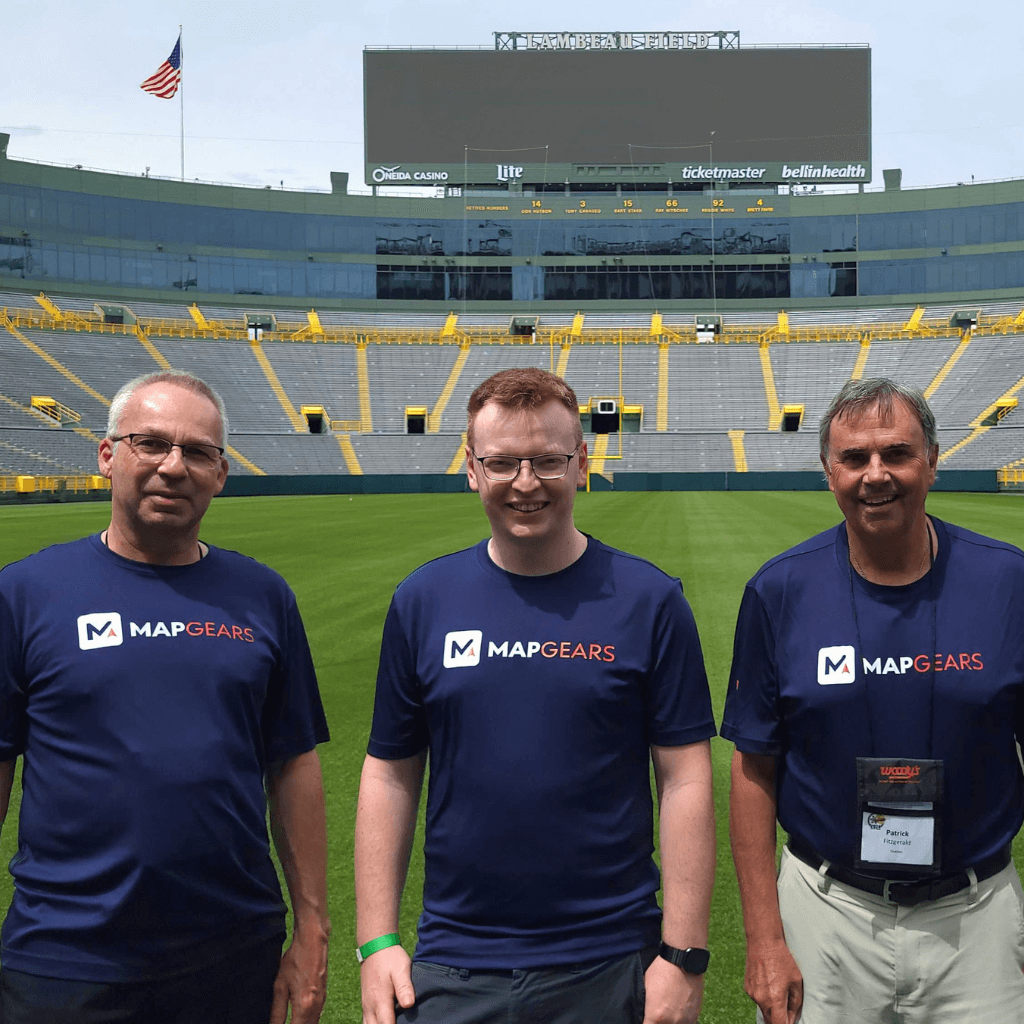

The post Recap from the 56th International Snowmobile Congress appeared first on Mapgears.
-
sur Mappery: Armidale Information Centre
Publié: 8 July 2024, 11:00am CEST
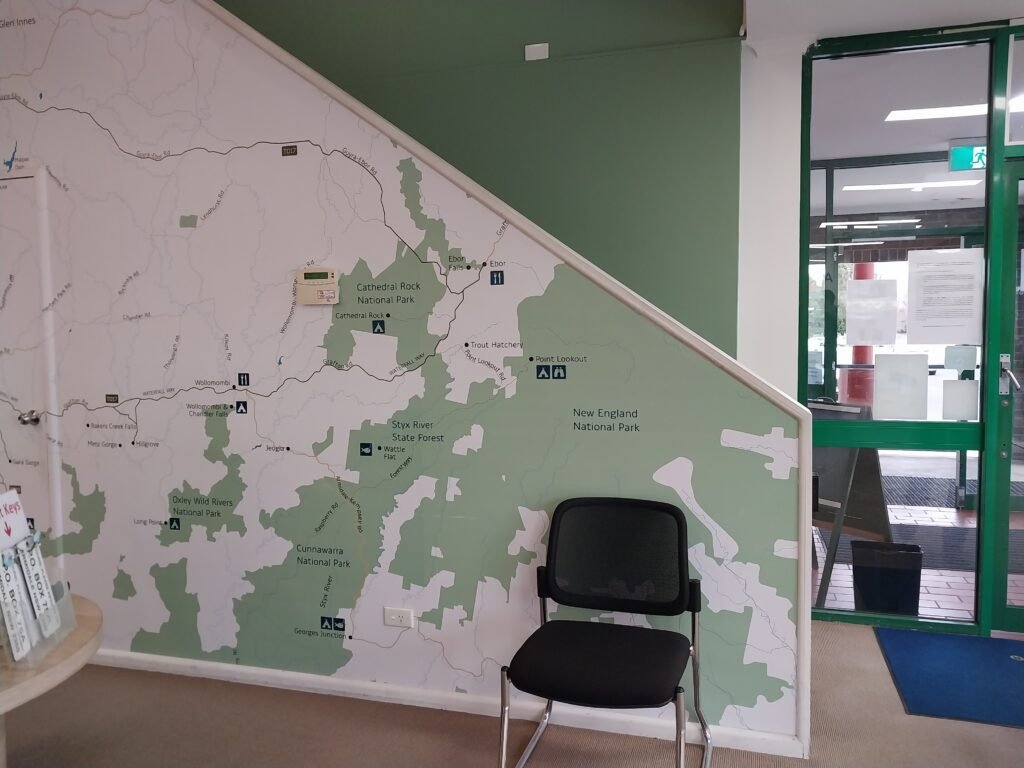
Anna Barca spotted this map on the staircase at the Armidale Information Centre. She said “The use of the staircase to display local attractions (mainly National Parks) is clever, turning a boring wall into a amazing eye-catching source of information.”
Good spot Anna and welcome to the Mappery community with your first map in the wild.
MapsintheWild Armidale Information Centre
-
sur QGIS Blog: Plugin Update – April to May, 2024
Publié: 8 July 2024, 9:04am CEST
Between April and May there were 33 new plugins published in the QGIS plugin repository.
Here follows the quick overview in reverse chronological order. If any of the names or short descriptions catches your attention, you can find the direct link to the plugin page in the table below:
Swiss GeoAdmin Bulk Geocoder Bulk geocoding of Swiss building addresses using the geocoding service of geo.admin.ch, the portal of swisstopo. EDAC Tools A toolbox containing various Python-based tools developed by the Earth Data Analysis Center (EDAC) at the University of New Mexico. CompareClassA Compare two datasets of GPKG pointZ geometry based on french legislation formatting “class A”. Stats By Polygon This plugin creates plots for statistics of raster bands based on selected polygon feature. UMap This plugin enables any user to transform a stack of digital bathymetric data terrain models into a bathymetric community map. SkyGIS This is a plugin to download files from Skydeck, process it in QGIS and upload the results back to Skydeck portal. Amazon Location Service QGIS Plugin for Amazon Location Service. CIGeoE Copy Paste Features 3D Copy and paste features from one layer to another of the same type preserving original Z coordinate. CIGeoE Translate To Fit To Adjacent Polygon Do a polygon translation to the nearest polygon, by making it coincide their nearest vertices. CIGeoE Toggle Vertex Visibility Toggle vertex’s marker visibility. CIGeoE Reverse Line Reverses a selected line. UA Coordinates Transformation ????????????? (???????????) ????????? ??????????? ???? ????? ???????? API ????????? ??????????? ??????.
Translation: Transformation of vector layer coordinates through the official API of the State Geodetic Network.GeoBasis_Loader GeoBasis_Loader (Open Data GeoBasisdaten). Viper (QGIS snake clone) Snake clone using vector layers and QGIS canvas. jpdata Download and load various data of Japan. S2 Toolkit Tools for the S2 Geometry. PL-2000 Konwerter wspó?rz?dnych punktu uk?adu PL-ETRF2000 do uk?adu PL-2000.
Translation: PL-ETRF2000 point coordinate converter to PL-2000 system.Luftbildfinder NRW Find and display aerial images (German State of North Rhine-Westphalia) – Luftbilder finden und laden für NRW. UDef-ARP Plugin UDef-ARP for QGIS. Route Builder “Route Builder” is a QGIS plugin with a set of tools that calculates shortest routes in street networks using data from OpenStreetMap (OSM) and using the A* (A Star) algorithm. Users can define a region, define origin and destination points (O/D) using the coordinates collected by the plugin, these coordinates of the nodes and thus calculate the shortest route between them. Transition-QGIS Access a Transition transit planning server data and functionalities from QGIS. PG service parser View, edit or copy PG service entries. Skråfotos Opslag på Dataforsyningens Skråfotos.
Translation: Notice on Dataforsyningens Skråfotos.OD_LSA_Loader (Open Data Land Sachsen Anhalt Loader) OD_LSA_Loader (Open Data Land Sachsen Anhalt Loader) – Plugin Deprecated QuickWebViewer Publish your QGIS project online as web map. ActiveBreak ActiveBreak is a plugin for QGIS that emits messages at the top of the canvas at time intervals from the start of work, reminding the user to take an active break, take their lunch and/or reminders indicating to save their QGIS project. QGIS Shoreline Change Analysis Tool A plugin for Shoreline Change Analysis (SCA). eMapTools This plugin propose retention trees and riparian buffer zones based on ecological values. NextGIS OGRStyle Capture OGR Style in ONE click to paste them into a spreadsheet. landXMLtoDB_Free Provides LandXML to Database tools, etc, storing to PostGIS initially, later to Oracle and MS SQL. RRR-reader Reads RRR files. Spatial Analyzer Spatial Analysis Tools. Japan GSI Point Collector This plugin collects xyz points from gsi website. The selection should be within Japan boundary. We would like this opportunity to highlight two plugins, Viper (QGIS snake Clone) and Active Break.
Viper allows to emulate in QGIS canvas the popular game Snake, providing a fun time and a bit of nostalgia for the “older” users. However it goes further than that, as it serves the purpose of teaching about geospatial concepts such as geometry objects (points, polygons) with their properties and methods, spatial indexing in the form of R-Tree, but also programming in QGIS, as well as other aspects.

On a more serious tone, if it can be said that, we present Active Break, a plugin that “simply” presents messages at specific time intervals, which can be personalized by the user and range from the more technical such as “save your project”, personal or motivational like quotes from hundreds of people on multiple subjects, or perhaps the most important, routinely reminders to take a break, relax or go have lunch. This considering the long hours we spent daily in front of the computer, with all the physical and mental health, as well as social implications. Congratulations on both authors!
-
sur Free and Open Source GIS Ramblings: New MovingPandas tutorial: taking OGC Moving Features full circle with MF-JSON
Publié: 8 July 2024, 8:00am CEST

Last week, I had the pleasure to meet some of the people behind the OGC Moving Features Standard Working group at the IEEE Mobile Data Management Conference (MDM2024). While chatting about the Moving Features (MF) support in MovingPandas, I realized that, after the MF-JSON update & tutorial with official sample post, we never published a complete tutorial on working with MF-JSON encoded data in MovingPandas.

The current MovingPandas development version (to be release as version 0.19) supports:
- Reading MF-JSON MovingPoint (single trajectory features and trajectory collections)
- Reading MF-JSON Trajectory
- Writing MovingPandas Trajectories and TrajectoryCollections to MF-JSON MovingPoint
This means that we can now go full circle: reading — writing — reading.
Reading MF-JSONBoth MF-JSON MovingPoint encoding and Trajectory encoding can be read using the MovingPandas function
read_mf_json(). The complete Jupyter notebook for this tutorial is available in the project repo.Here we read one of the official MF-JSON MovingPoint sample files:
traj = mpd.read_mf_json('data/movingfeatures.json') Writing MF-JSON
To write MF-JSON, the Trajectory and TrajectoryCollection classes provide a
to_mf_json()function:
The resulting Python dictionary in MF-JSON MovingPoint encoding can then be saved to a JSON file, and then read again:
import json
with open('mf1.json', 'w') as json_file:
    json.dump(mf_json, json_file, indent=4)
Similarly, we can read any arbitrary trajectory data set and save it to MF-JSON.
For example, here we use our usual Geolife sample:
gdf = gp.read_file('data/demodata_geolife.gpkg')
tc = mpd.TrajectoryCollection(gdf, 'trajectory_id', t='t')
mf_json = tc.to_mf_json(temporal_columns=['sequence'])
And reading again
import json
with open('mf5.json', 'w') as json_file:
    json.dump(mf_json, json_file, indent=4)
tc = mpd.read_mf_json('mf5.json', traj_id_property='trajectory_id' )
Conclusion
The implemented MF-JSON support covers the basic usage of the encodings. There are some fine details in the standard, such as the distinction of time-varying attribute with linear versus step-wise interpolation, which MovingPandas currently does not support.
If you are working with movement data, I would appreciate if you can give the improved MF-JSON support a spin and report back with your experiences.
-
sur Mappery: Nikko on a Shopping Bag
Publié: 7 July 2024, 11:00am CEST
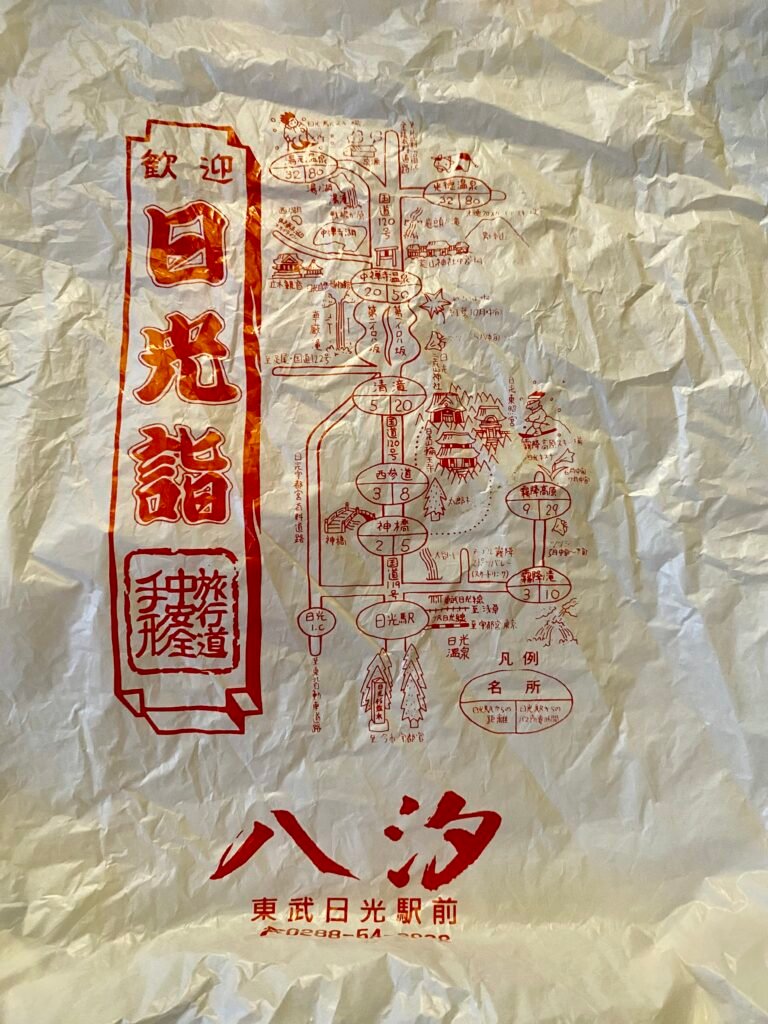
Maarten Pullen sent me this picture of a shopping bag with a map of Nikko, Japan.
“Yesterday I stumbled upon a plastic bag from Nikko, Japan, with several tourist spots on it. I wrote a little blog post (in Dutch, but can be translated) about the background of the map
[https:]Here is a rough translation of the first part of Maarten’s blog post:
“For some time now I have been following Maps in the Wild, a collective that collects maps for aesthetic purposes in the broadest form. The core idea is that printed maps have less functional use thanks to digitization and are therefore used more for aesthetic reasons.
Or it’s just an excuse to collect a lot of eye-catching cards, which is also a good idea in my opinion.
A plastic bag from Japan came from the attic. And suddenly I realized that you can also translate it. And it also turned out to have a schematic map, showing, among other things, a bridge, temples, a ski resort and a waterfall (or Onsen?).
I got the bag in 2010 in Nikko, Japan”
And that is a perfect Map in the Wild! Thanks Maarten
MapsintheWild Nikko on a Shopping Bag
-
sur OPENGIS.ch: Rapid Mapping the Ticino Floods and Landslides with QField Rapid Mapper
Publié: 7 July 2024, 6:11am CEST
Pièce jointe: [télécharger]
QField Rapid Mapper is a project for the QField mobile app, which allows emergency responders, civil protection, military, and citizens to assess and report damages from natural catastrophes by quickly sharing geolocated images, videos and audio. QField Rapid Mapper offers real-time data collection, mapping and sharing to help enhance disaster response and coordination.
Join the effort OPENGIS.ch Supports Flood Mapping Efforts in Ticino
QField and QFieldCloud are open-source, and OPENGIS.ch is donating the needed QFieldCloud infrastructure and expertise to help map the floods in Ticino in 2024After discussing with the Protezione Civile Locarno e Valle Maggia and the Centro di Competenza per la geoinformazione (CCGEO), we are proud to announce that OPENGIS.ch is donating the necessary QFieldCloud infrastructure and dedicated projects for a rapid crowdsourcing POC to aid in mapping the 2024 floods in Ticino. This crowdsourcing initiative aims to provide essential support to professionals and volunteers working on flood and landslide assessment and recovery.
Empowering Response with Advanced Technology What is needed?Photographing damaged houses and infrastructure is the most critical aspect of this mapping initiative. These images provide crucial information for assessing the extent of the damage, planning rescue and reconstruction operations, and ensuring that resources are allocated effectively. It’s also important to document any submerged or damaged vehicles, as they offer additional insights into the disaster’s impact. During these activities, it’s essential to be careful and respect the privacy and property of others, avoiding capturing license plate numbers or entering destroyed buildings without permission. Using QField Rapid Mapper can contribute to a faster and more coordinated emergency response while ensuring respect for those affected.
The QFieldCloud infrastructure enables efficient, real-time data collection and sharing, ensuring that accurate and up-to-date information is available to all stakeholders involved in the flood response. This effort underscores our commitment to leveraging technology for social good and environmental resilience.
How You Can Get Involved- if you don’t have a QFieldCloud account yet, sign up at [https:]]
- fill out the quick participation form at [https:]]
By participating, you will have access to powerful tools for field data collection and can contribute valuable information to the ongoing efforts in Ticino. All the data collected will be released under the Creative Commons CC0 1.0 public domain license.
Join the EffortUsing QField and QFieldCloud, you can help create detailed maps crucial for understanding the impact of the floods and planning effective recovery strategies. Your contributions will make a significant difference in managing and mitigating the effects of this natural disaster.
Join the effortVisit our QField Rapid Mapper project page for more information on how QField and QFieldCloud can assist in flood mapping and other field data collection projects.
Together, we can make a difference. Join us in mapping the floods in Ticino and support the community’s recovery efforts.
-
sur GRASS GIS: Nix development environment and package
Publié: 6 July 2024, 12:00pm CEST
You can now develop and run GRASS GIS with Nix A new option for creating a GRASS development environment and a unique way of running GRASS directly from the Git source code was implemented using the Nix package manager. This idea was presented by Ivan Mincik during the GRASS GIS Community Meeting in Prague. The Nix development environment provides a stable and reproducible environment for all developers and can significantly simplify the onboarding process of new contributors. -
sur Mappery: King David’s Tower 7 – Stefan Illes 3D Map of Jerusalem
Publié: 6 July 2024, 11:00am CEST
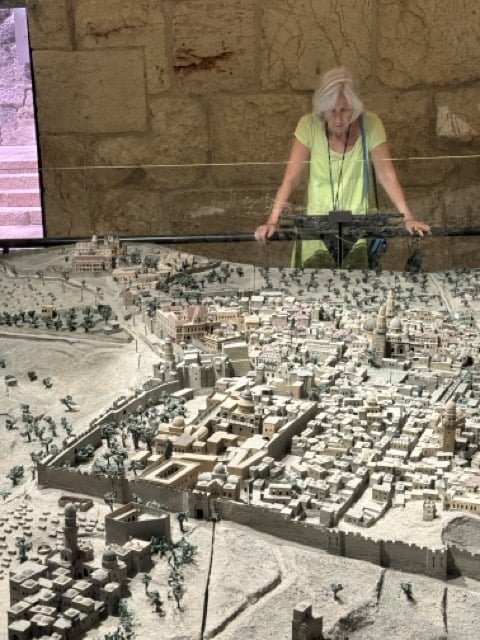
This 3D map of Jerusalem in the 19th century is massive and spectacular. It was brilliantly lit to take you through a day in the life of the city from the sun rising in the east through the day to sunset.
“Stefan Illés, an Austro-Hungarian Catholic, arrived in Jerusalem in 1864 and worked as a bookbinder at the Franciscan publishing house. Illés built a model of Jerusalem that was exhibited in the Ottoman Pavilion at the World Expo in Vienna in 1873. The model, which was highly acclaimed, was displayed throughout Germany and Switzerland. In 1878, it was purchased by a distinguished family from Geneva. Illés’s impressive model is cartographically accurate and is considered a reliable scientific source for the history and geography of Jerusalem in the 19th century.”
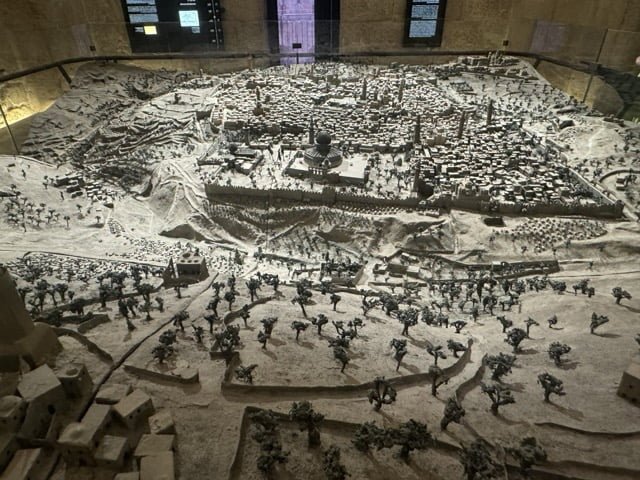
And that finishes my maps in the wild selection from King David’s Tower. There were loads more maps showing the evolution of the city through the different eras of history from the Egyptian period through Assyrian, Babylonian, Persian, Islamic, Crusader and Ottoman eras to the modern day. Well worth a visit.
MapsintheWild King David’s Tower 7 – Stefan Illes 3D Map of Jerusalem
-
sur PostGIS Development: PostGIS 3.5.0alpha2
Publié: 6 July 2024, 2:00am CEST
The PostGIS Team is pleased to release PostGIS 3.5.0alpha2! Best Served with PostgreSQL 17 Beta2 and GEOS 3.12.2.
This version requires PostgreSQL 12 - 17, GEOS 3.8 or higher, and Proj 6.1+. To take advantage of all features, GEOS 3.12+ is needed. SFCGAL 1.4-1.5 is needed to enable postgis_sfcgal support. To take advantage of all SFCGAL features, SFCGAL 1.5 is needed.
3.5.0alpha2This release is an alpha of a major release, it includes bug fixes since PostGIS 3.4.2 and new features.
-
sur Mappery: King David’s Tower 6 – The Madaba Map
Publié: 5 July 2024, 11:00am CEST
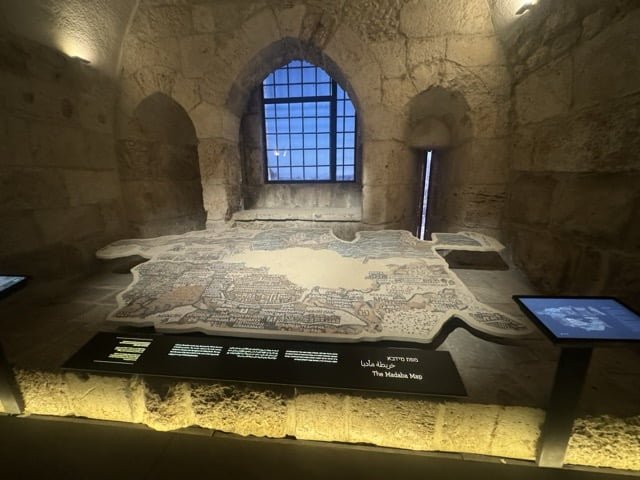
The Madaba mosaic map is one of the oldest surviving maps of Jerusalem.
“A famous Byzantine mosaic map, discovered in 1896 in the town of Madaba in Jordan. The mosaic, dated to the sixth century, emphasizes Christian sites throughout the biblical lands. The map bears the names of the sites in Greek. In the center of the map, greatly enlarged, is a map of Christian Jerusalem”
Cartographers have superimposed an image of the Madaba map onto a modern map of the old city of Jerusalem and found that the mosaic was remarkably accurate
MapsintheWild King David’s Tower 6 – The Madaba Map
-
sur Mappery: King David’s Tower 5 – Jerusalem Monopoly
Publié: 4 July 2024, 11:00am CEST

An early version of Monopoly based in Jerusalem from the period of the British Mandate.
MapsintheWild King David’s Tower 5 – Jerusalem Monopoly


-
sur Déplacements dans Paris x JO et Para 2024
Publié: 4 July 2024, 7:22am CEST par Caroline Chanlon
L’organisation des Jeux Olympiques et Paralympiques à Paris cet été pose la question des déplacements parisiens. Chez Oslandia, le mot d’ordre est très clair : aucun déplacement dans Paris ! Et si la rencontre « physique » est indispensable, nous pouvons proposer à nos clients et partenaires d’utiliser des locaux dans d’autres villes, Lyon par exemple.
Ensuite, il s’agit de bien cerner ce qui est indispensable ou pas … Pour rappel, Oslandia fonctionne en full remote et cela depuis près de 15 ans ! L’équipe est répartie dans la France entière, tout comme nos clients, et cela ne nous a jamais empêché de livrer de beaux projets

En parlant d’ailleurs de beau projet et de JO, la plateforme JOPTIMIZ, composée de plusieurs applications, va prochainement permettre de fournir des services de calcul d’itinéraires adaptés aux contraintes réglementaires mises en place par la Préfecture pendant l’été et effervescence des JO et Para JO.
Oslandia a plus spécifiquement collaboré sur l’outil Itineriz en partenariat avec ALLOHOUSTON, notre partenaire qui a également travaillé sur CirQliz, un outil qui permet aux entreprises de faire valider leurs véhicules avant les JO, délivrant un QR code par véhicule pour faciliter les contrôles de police en zone bleue.
Itineriz permet de son côté d’adapter son trajet en fonction des restrictions et dérogations liées aux Jeux 2024 et à la ZFE de votre ville.
Voilà des applications qui seront bien utiles cet été

-
sur PostGIS Development: PostGIS 3.5.0alpha1
Publié: 4 July 2024, 2:00am CEST
The PostGIS Team is pleased to release PostGIS 3.5.0alpha1! Best Served with PostgreSQL 17 Beta2 and GEOS 3.12.2.
This version requires PostgreSQL 12 - 17, GEOS 3.8 or higher, and Proj 6.1+. To take advantage of all features, GEOS 3.12+ is needed. To take advantage of all SFCGAL features, SFCGAL 1.5.0+ is needed.
3.5.0alpha1This release is an alpha of a major release, it includes bug fixes since PostGIS 3.4.2 and new features.
-
sur Camptocamp: Camptocamp at GeOcom 2024
Publié: 4 July 2024, 2:00am CEST
Pièce jointe: [télécharger]
From June 17 to 21, Camptocamp helped organize and host the annual meeting of users and developers of the geOrchestra data infrastructure solution, to which we've been an active contributor for many years. -
sur Camptocamp: The 3D technology serving public transport in Rennes Métropole
Publié: 4 July 2024, 2:00am CEST
Pièce jointe: [télécharger]
In continuation of developments linked to the Rennes Métropole territorial cooperation platform 'Coopter', Camptocamp is proud to present to you the latest application in our triptych: the TRAMBUS application. -
sur Mappery: King David’s Tower 4 – The Islamic World in the 10th Century
Publié: 3 July 2024, 11:00am CEST
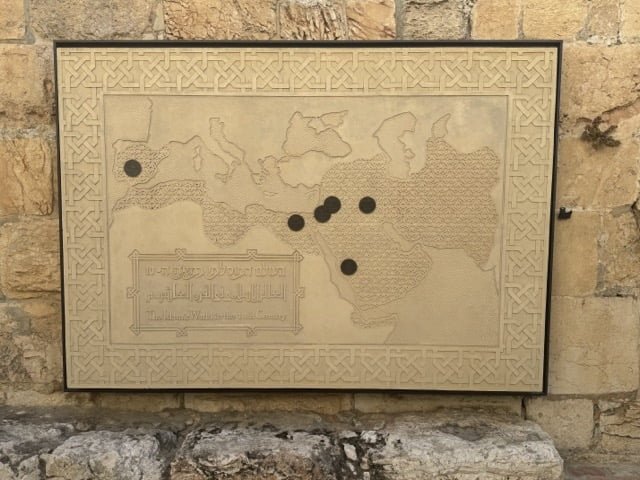
This carved stone map shows the extent of the Islamic World in the 10th Century, quite a remarkable expansion in three centuries. It’s a beautiful piece, spoilt (IMO) by the heavy black markers.
MapsintheWild King David’s Tower 4 – The Islamic World in the 10th Century
-
sur GeoSolutions: GeoNode 4.3 release
Publié: 2 July 2024, 3:57pm CEST
Pièce jointe: [télécharger]
You must be logged into the site to view this content.
-
sur Mappery: King David’s Tower 3 – Between Heaven and Earth
Publié: 2 July 2024, 11:00am CEST
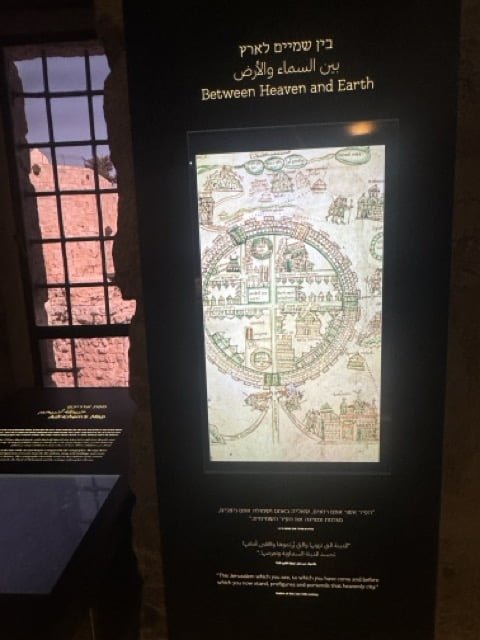
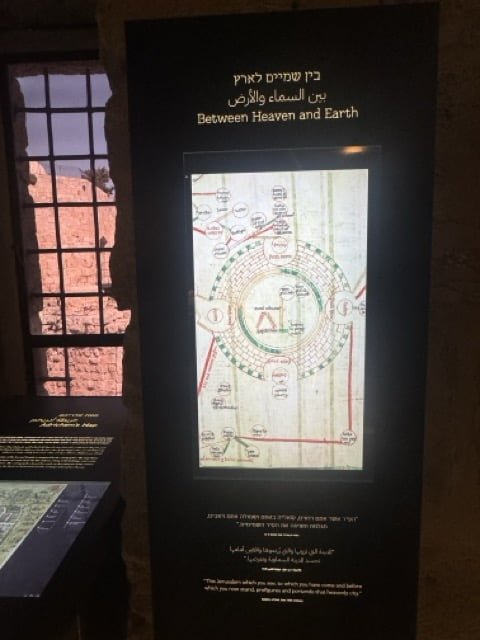
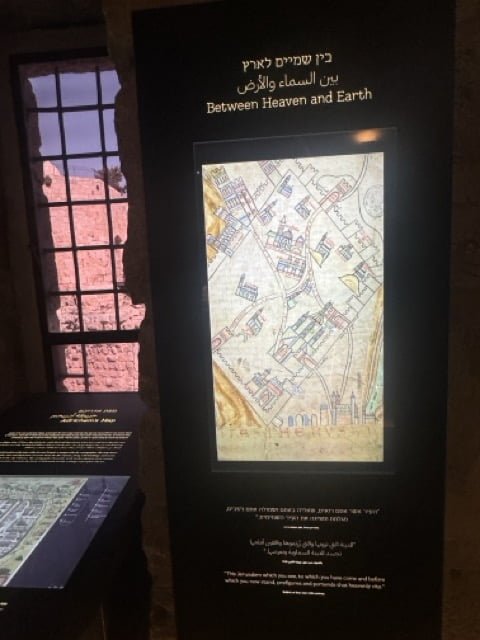
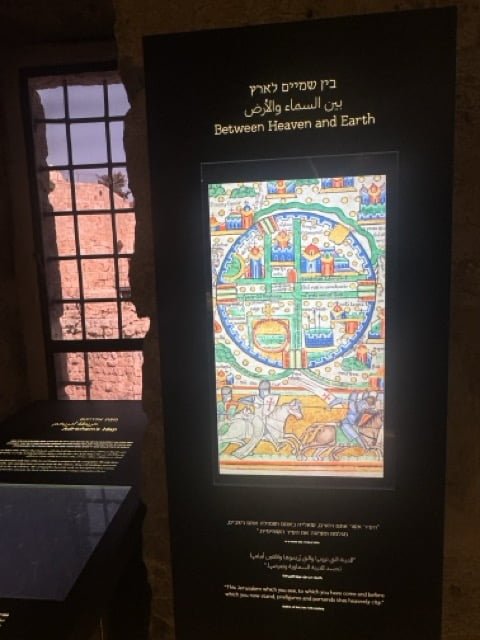
This display showed maps of Jerusalem from different periods, I like the way the maps are juxtaposed against the view through the window.
MapsintheWild King David’s Tower 3 – Between Heaven and Earth
-
sur Oslandia x Open Source Experts
Publié: 2 July 2024, 6:43am CEST par Caroline Chanlon
Open Source Experts est un guichet unique fédérant les acteurs de l’open source en France dans un objectif de développement de l’écosystème et d’accès à de nouveaux marchés.
OSE centralise les experts open source, offrant ainsi un interlocuteur unique pour les donneurs d’ordres.
Ce regroupement des acteurs open source a déjà montré ses capacités avant même l’officialisation OSE, par exemple pour le marché de support open source de la CNAM
Oslandia est fière de faire partie des experts « partenaires qualifiés » open source avec OSE, pour accompagner toutes les organisations à leurs usages et migrations vers des SIG libres !
Bravo pour cette initiative portée par nos confrères Arawa, BlueMind, FactorFX, Inno3 et Worteks
-
sur GeoTools Team: GeoTools 28.2 Released
Publié: 2 July 2024, 6:04am CEST
The GeoTools team is pleased to share the availability GeoTools 28.2 : geotools-28.2-bin.zip geotools-28.2-doc.zip geotools-28.2-userguide.zip geotools-28.2-project.zip This release is also available from the OSGeo Maven Repository and is made in conjunction with GeoServer 2.22.2 and GeoWebCache 1.22.1.Update 2024-07-1: CVE-2024-36404 patch geotools-28.2-patches.zip Fixes -
sur GeoTools Team: GeoTools 27.4 Released
Publié: 2 July 2024, 6:04am CEST
The GeoTools team is pleased to share the availability GeoTools 27.4 : geotools-27.4-bin.zip geotools-27.4-doc.zip geotools-27.4-userguide.zip geotools-27.4-project.zip This release is also available from the OSGeo Maven Repository and is made in conjunction with GeoServer 2.21.4.Update 2024-07-1: CVE-2024-36404 patch geotools-27.4-patches.zip Fixes and improvements -
sur GeoTools Team: GeoTools 27.5 Released
Publié: 2 July 2024, 6:02am CEST
The GeoTools team is pleased to share the availability GeoTools 27.5:geotools-27.5-bin.zipgeotools-27.5-doc.zipgeotools-27.5-userguide.zipgeotools-27.5-project.zipThis release is also available from the OSGeo Maven Repository and is made in conjunction with GeoServer 2.22.3 and GeoWebCache 1.22.2.Update 2024-07-1: CVE-2024-36404 patch -
sur KAN T&IT Blog: Expo Curitiba 2024 ¡conociendo la ciudad del futuro!
Publié: 1 July 2024, 9:37pm CEST
Queremos compartir la experiencia de nuestro CEO, Ariel Anthieni, en Expocuritiba 2024, la Feria Internacional de Ciudades Inteligentes. Durante los días 17 al 22 de marzo, Ariel tuvo el privilegio de representar a nuestra empresa en este evento único que reunió a destacados actores en el ámbito de las ciudades inteligentes en la hermosa ciudad de Curitiba, Brasil.
Curitiba es reconocida a nivel mundial como un ejemplo de ciudad inteligente debido a sus innovadoras políticas urbanas que han transformado la calidad de vida de sus habitantes. Su eficiente sistema de transporte público, sus áreas verdes bien planificadas y su enfoque en la sostenibilidad la convierten en un modelo a seguir para otras ciudades.
Durante el evento, Ariel tuvo el honor de cruzar unas palabras con Rafael Greca, el alcalde de Curitiba. Se sorprendió gratamente por su calidez e increíble predisposición para conversar y conocer a quienes estábamos allí.
Nuestro CEO participó activamente en las diferentes actividades de la feria, incluyendo la asistencia a charlas y conferencias con reconocidos expertos en el campo de la innovación urbana, la visita a espacios temáticos y la exploración de soluciones tecnológicas innovadoras para el desarrollo sostenible de las ciudades. Tuvo la oportunidad de presentar al MapViewer, un visor digital diseñado por Kan Territory & IT para la supervisión y gestión virtual de las ciudades. Este permite monitorear y controlar diferentes aspectos de ese lugar, como el flujo del transporte público, la actividad de los centros de salud y otros servicios esenciales, a través de la recopilación y visualización de datos geoespaciales.
Ariel también destacó que el MapViewer utiliza un enfoque de catastro multifiduciario, capaz de manejar información de múltiples fuentes y tipos, como datos catastrales, topográficos y de infraestructura, proporcionando así una vista integral de la ciudad. Además, habló sobre la evolución digital de esta tecnología, introduciendo el concepto de «gemelos digitales«, que son representaciones virtuales de una ciudad. Con esta herramienta, los administradores y planificadores urbanos pueden simular escenarios hipotéticos y tomar decisiones más informadas para el desarrollo sostenible.
Sin dudas, su actividad en Expocuritiba 2024 fue una oportunidad invaluable para conocer las últimas tendencias en tecnología urbana, establecer contactos estratégicos y compartir conocimientos con otros líderes en el ámbito de las ciudades inteligentes.Felicitamos a Ariel por su destacada participación en este evento tan significativo y esperamos seguir contribuyendo al desarrollo de ciudades más inteligentes y sostenibles en el futuro. Muchísimas gracias Lucía Bellocchio por haberlo hecho posible ¡Hasta el próximo año!
-
sur Mappery: King David’s Tower 2 – The Clover Map
Publié: 1 July 2024, 11:00am CEST

Bunting’s Clover Map is an archetypal map of the world from a time when only three continents were known to Europeans – Europe, Africa and Asia.
Die ganze Welt in einem Kleberblat
[https:] FL7074006
Woodcut Map showing three continents: Europe, Asia and Africa in the form of a clover leaf with the representation of Jerusalem in the center. America on the lower left corner.
From: Buenting, Heinrich. Itinerarium Sacrae Scripturae. (Travel book covering the entire Holy Scripture) Helmstadt, Jacobus Lucius, 1585. Part I, between pp. 4-5Coincidentally I bought a wooden puzzle based on this clover map in a craft market. Apparently the solution requires over 250 moves, I am still working on it! (this is the solved state)

MapsintheWild King David’s Tower 2 – The Clover Map
-
sur QGIS Blog: Plugin Update – February to March, 2024
Publié: 1 July 2024, 9:04am CEST
From February to March of this year, 58 new plugins were published in the QGIS plugin repository.
Here follows the quick overview in reverse chronological order. If any of the names or short descriptions catches your attention, you can find the direct link to the plugin page in the table below:
Indonesian Multi-scaled Grid System This plugin automate the determination of Indonesia’s Environmental Support and Capacity. NDVI to Variable Nitrogen Application Map This plugin was developed for producing variable nitrogen application maps based on index (e.g. NDVI, EVI) values. Dynamic Flow Compare two datasets of GPKG pointZ geometry based on french legislation formatting “class A”. Stats By Polygon Dynamic Flow is a QGIS plugin to estimate the spatio-temporal 3D gradient flow from the point observation of the attributes values such as aggregated cell-phone mobility data. On-the-Fly-Shortest-Path Interactively find shortest path between points over a line network and calculate the Fiber Loss Budget of a fiber optic network (backbone or FTTH) SMODERP2D This plugin calculates hydrological and erosion processes on individual plots or small catchments. Multifilter Filter multiple layers NDVI and EVI Index Calculator This plugin calculates NDVI and EVI index from Sentinel 2 B02, B04 and B08 Bands. GeoZone QGIS plugin for adding and modifying zone data in compliance with the GeoZone schema, facilitating sharing with partners or uploading to a central web repository. CIGeoE Mirror View Add one or more panels synchronized with the main panel. SIOSE Tools Herramientas SIOSE. RioGIS 2 Export to WinCan. Clasificación de redes hídricas Este plugin clasifica las redes hídricas por medio de una etapa de enriquecimiento y otra de lógica difusa. Advertencia: Versión experimental, algunos procesos pueden ser largos de aplicar. AutoStyler Apply QML style files to new layers. QML files are stored in {qgis_home}\Styles directory. QML files will be applied to a vector layer when the QML file’s basename is found as a substring of the new layer’s name. QML files will be applied to a raster layer when the QML file’s label token is found as a substring of the new layer’s name. The label token is raster_style_{label}.qml. Delta Shares With this plugin you can load data from delta shares Simple ETL A simple ETL for spatial data Flood Path Finder Developed with Python by Emerson N. Santos – 2024 MongoDB Layer This plugin gives the possibility to create a layer from MongoDB datasource Power Pin PL Plugin eksportuje pinezk? do serwiów typu geoportal. Pin to popular polish and world maps portal. Plugin export pin to popular geoportal like serives Mineral Exploration Web Services This plugin connects your QGIS User Profile to many openly hosted web services related to mineral exploration. These include Country and State geological surveys that provide mapped geology and data such as mineral occurence locations, geophysics, geochemistry etc. OrfeoToolbox Provider OrfeoToolbox Processing provider. MitiConnect MitiConnect integrates ecological connectivity in mitigation hierarchy based on landscape graphs. Compare_attributes Compare Attributes Geo Cluster This plugin allows you to cluster different territorial scopes. Estonian Oblique Aerial Photographs Get the oblique aerial photographs of Estonia at the clicked location on the map Two distances intersection Get the intersection of two distances (2D cartesian) Show Corona CAST by click This plugin opens a webpage showing the Corona CAST map in the clicked coordinates on the canvas Roll Design and analysis of 3D seismic survey geometries moniQue Monoplotting oblique images with uncertainty estimation. Modular Layout Grid Guides This plugin creates a modular layout grid for print layouts easyPlugin Plugin which creates a simple QGIS plugin templates ready for install, editing and testing Samon Saisie monoscopique sur la BD Ortho SADI Processor A plugin to Process Standardized Agricultural Drought Index. SciPy Filters Filter collection implemented with SciPy Data Validator Prototype for vector data validation ZUMbox Urban planning related tools UA_NGO_PDF_Parser This plugin parse pdf files with NGO data and create table with result Marine Tools Tools for marine habitat mapping Map tools QGIS plugin for little helpers in map production Style Exporter Plugin export styles of selected layers to individual file with name same as layers name. Aino AI assistant to download data from OSM gis3d This plugins generates a 3D model based on the inputs Zonal Exact Extract Zonal Statistics of rasters using Exact Extract library Verkeersborden Import dutch traffic signs. NVDB Les NVDB (Norwegian Administration Road Database) it’s a plugin to analyse and manipulate road objects, like (road references, trees, light poles, traffic signs, construction area, smart devices like IP Camera, tunnels, bridges, etc) Fluvial Corridor Toolbox Fluvial Corridor Toolbox CIGeoE Reshape Features 3D Reshape a feature in 3D Pixel Purity Index Pixel Purity Index algorithm C-GEO Wizualizacja GML demo Wtyczka wczytuje oraz wizualizuje dane EGiB, GESUT, BDOT500 zapisane w plikach GML. pqkmeans-clustering This clustering algorithm is a quantized version of the K-Means algorithm that is memory and computationaly more efficient. HedgeTools HedgeTools is a plugin for QGIS designed to extract and characterize hedges, aiming to streamline field efforts by providing information about hedge health. PyXel_Sync PyXel_Sync SmartSDI Wtyczka SmartSDI (Geo-System) PL: Pobieranie danych wektorowych: dzia?ki, budynki, adresy EN: Downloading vector data for Poland: parcels, buildings, addresses Quick_search Quick_search Environmental Data Retrieval Environmental Data Retrieval QGIS plugin DigiAgriApp Plugins to work with DigiAgriApp server QTalsim This plugin creates hydrological response units (HRUs) suitable for Talsim ( [www.talsim.de] ) and allows users to connect to a Talsim DB. RubberSheetingEtc Provides Rubber Sheeting and Two Point Transformations, storing to PostGIS, Oracle and MS SQL. The Rubber Sheeting algorithm uses supplied Shift Vectors and calculates the weighted average shift from the 10 nearest Shift Vectors. The Two Point Transformations handles themes with and without a CRS. -
sur Free and Open Source GIS Ramblings: New interactive trajectory plots for MovingPandas & experiments on their interpretation using ChatGPT 4o
Publié: 30 June 2024, 2:52pm CEST
With the release of GeoPandas 1.0 this month, we’ve been finally able to close a long-standing issue in MovingPandas by adding support for the explore function which provides interactive maps using Folium and Leaflet.

Explore() will be available in the upcoming MovingPandas 0.19 release if your Python environment includes GeoPandas >= 1.0 and Folium. Of course, if you are curious, you can already test this new functionality using the current development version.
This enables users to access interactive trajectory plots even in environments where it is not possible to install geoviews / hvplot (the previously only option for interactive plots in MovingPandas).
I really like the legend for the speed color gradient, but unfortunately, the legend labels are not readable on the dark background map since they lack the semi-transparent white background that has been applied to the scale bar and credits label.

Speaking of reading / interpreting the plots …
You’ve probably seen the claims that AI will help make tools more accessible. Clearly AI can interpret and describe photos, but can it also interpret MovingPandas plots?
ChatGPT 4o interpretations of MovingPandas plots
Not bad.
And what happens if we ask it to interpret the animated GIF from the beginning of the blog post?

So it looks like ChatGPT extracts 12 frames and analyzes them to answer our question:

Its guesses are not completely off but it made up the facts such as that the view shows “how traffic speeds vary over time”.
The problem remains that models such as ChatGPT rather make up interpretations than concede when they do not have enough information to make a reliable statement.
-
sur Mappery: King David’s Tower 1 – Adrichem’s Map
Publié: 30 June 2024, 11:00am CEST
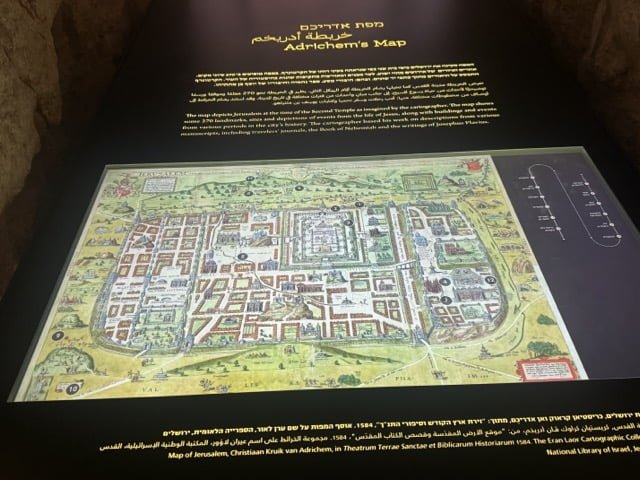
While we were in Israel we spent some time in Jerusalem, friends suggested that we visit the new museum about Jerusalem in King David’s Tower. It is a fantastic museum in an ancient location which reflects the different influences in the city over three millenia. Amongst the many exhibits were a lot of maps, ancient, modern, interactive, over the next few days I will share a few.
Adrichem was a 16th century Dutch cartographer, this map of Jerusalem shows remarkable detail
“A map of Jerusalem created by the Dutch cartographer Christiaan van Adrichem in 1584. In this beautifully illustrated map are drawings that represent events and figures from the Old and New Testaments. Toward the center of the map the Jewish Temple can be seen together with a drawing of the High Priest, the altar and the vessels used in the Temple. To the right of the Temple is the Royal Palace, pictures of King Solomon on his throne, and even Bathsheva bathing on her rooftop. Other drawings on the map, such as the Via Delarosa and images of the Crucifixion, depict the Christian history of Jerusalem.”
[https:]MapsintheWild King David’s Tower 1 – Adrichem’s Map
-
sur Mappery: Globe Escape Alert!
Publié: 29 June 2024, 11:00am CEST
Marc-Tobias spotted this little globe that had set out on a journey to freedom starting in Hannover, I wonder where it will end up?

Good luck little globe
MapsintheWild Globe Escape Alert!
-
sur gvSIG Team: Discurso de aceptación del Premio Nacional de Ciencias Geográficas
Publié: 28 June 2024, 4:13pm CEST
Excmo. Sr. Jesús Gómez, Subsecretario de Transportes y Movilidad Sostenible, distinguidas autoridades, señoras y señores
Es para mi un inmenso honor y una profunda satisfacción recibir, en nombre de la Asociación gvSIG, el primer Premio Nacional de Ciencia Geográficas que se otorga en España. Humildemente confesamos que ser los primeros en recibirlo, con la cantidad de personalidades y entidades que lo merecen, todavía acrecienta más la importancia que le damos a este galardón. Por otro lado, nos asegura que escucharan el mejor discurso de aceptación del premio de los habidos hasta la fecha.
Este galardón supone un reconocimiento extraordinario a la trayectoria y dedicación de un colectivo apasionado por la geografía, la tecnología y el conocimiento, entendidos como motores de cambio.
Empecemos por el término que da nombre a este galardón, la geografía. Tim Marshall, en su excelente ensayo «Prisioneros de la Geografía» concluía que si bien la geografía no dicta el desarrollo de todos los acontecimientos, puesto que las grandes ideas y líderes forman parte del tira y afloja de la historia, todos ellos deben actuar dentro de los confines que marca la geografía. El ex-presidente de los Estados Unidos, Barack Obama, nos decía que la geografía era mucho más que poner nombres en un mapa, que se trataba de entender la realidad. Los que nos han escuchado durante estos años bien saben que en la Asociación gvSIG siempre hemos afirmado que la realidad se manifiesta en el territorio. Todo existe en la medida que está en un lugar y en cómo se relaciona con lo que tiene alrededor. Por tanto, la dimensión geográfica o espacial de las cosas es un atributo fundamental para gestionar la realidad. Lo fue en el pasado, lo será en el futuro y, sin duda, lo es en el presente.
Lo que nos lleva a hablar del segundo concepto que nos apasiona, la tecnología. Con más de dos décadas en el S.XXI todos debemos ser conscientes que la tecnología impregna todo proceso productivo, económico, académico y social hasta el punto de convertirse en una herramienta imprescindible. Sin miedo a equivocarme podría afirmar que en esta sala hay más aparatos tecnológicos que personas. No podemos imaginar esa gestión de la realidad de la que hablábamos sin tecnología. Sabemos que España y la Unión Europea están apostando significativamente por la ciencia, la tecnología y la innovación como pilares fundamentales para su crecimiento y desarrollo sostenible. Por nuestra parte, en la Asociación gvSIG, siempre hemos hablado de la tecnología como un sector estratégico y seguiremos insistiendo mientras sea necesario. Las tecnologías de gestión de información geográfica, englobadas bajo el concepto de geomática, son aquellas que ni más ni menos nos permiten analizar, entender y gestionar el territorio, la geografía.
La geomática se aplica en la gestión de infraestructuras de todo tipo, en sectores como el del medio ambiente, la seguridad, la energía, la movilidad, la educación, la sanidad, la agricultura, el turismo,… es transversal a infinidad de temáticas y aplicable a infinidad de geografías.
Siendo así, deberíamos empezar a ser conscientes de que ser dependientes de un sector estratégico es una debilidad manifiesta. ¿Quién querría que nuestras administraciones, nuestras universidades, nuestras empresas, aquellas que trabajan en y con el territorio, fueran dependientes tecnológicamente? Aquí radica en gran parte la importancia y éxito del proyecto gvSIG, construir y desarrollar tecnologías para gestión de datos espaciales, de su dimensión geográfica, con software libre. Apostando por la soberanía tecnológica mediante el impulso de soluciones que otorgan todos los derechos y libertades a sus usuarios. Que evitan cualquier dependencia ya no de tecnologías, sino de los dueños de estas. No solo eso, la Asociación gvSIG ha impulsado un tejido industrial propio, especializado en geomática, convirtiendo a la Comunidad Valenciana y a España en un centro de referencia a nivel internacional. Hoy día no solo las tecnologías marca gvSIG se utilizan en todo el mundo, hoy día empresas españolas llevan a cabo por todo el planeta algunos de los más grandes proyectos relacionados con los sistemas de información geográfica. Concluyo este apartado reafirmando que apostar por tecnologías propias y libres puede ser, sin duda lo es, una decisión estratégica de primer orden.
Enlazamos con el último concepto que relacionaba con la actividad de la Asociación gvSIG, el conocimiento. Y en este punto quizá valga la pena hacer un recorrido por la historia de nuestra entidad.
No hay que olvidar que si hoy estamos aquí, recogiendo este importantísimo reconocimiento, es porque un día una administración pública, la Generalitat Valenciana, decidió dar el primer paso. El proyecto gvSIG ve la luz en 2004, con una primera versión de un producto de software que hoy forma parte de un completo catálogo de soluciones de geomática. Hoy no solo se habla, sino que se legisla, en España y en Europa, a favor de la reutilización, de compartir, de interoperar entre administraciones y de desarrollar tecnologías propias. En los comienzos de este siglo no era así. La Generalitat Valenciana no solo dio el primer paso, sino que supo compartir los logros con toda la comunidad internacional y dinamizar lo que acabaría siendo la Asociación gvSIG.
Hoy día sigue apostando por el proyecto, utiliza las tecnologías gvSIG en cada vez más áreas, desde agricultura a seguridad vial, desde industria a movilidad sostenible, contribuyendo a su desarrollo y, también, reutilizando todas las mejoras tecnológicas que continuamente se consolidan en el proyecto. Sin ir más lejos, la semana pasada La Agencia de tecnologías del gobierno danés publicó un informe en que ponía como principal caso de éxito del impulso de una tecnología en software libre por una administración pública a la Generalitat Valenciana. Hablaba de gvSIG.
Por tanto, este premio, este galardón, es en gran medida compartido con la Generalitat Valenciana y, en particular, con su Dirección General de Tecnologías de la Información y Comunicación.
A finales de 2009 nació la Asociación gvSIG. Un conjunto de personas, empresas, entidades decidimos escalar el impacto del proyecto. Para garantizar sus sostenibilidad por un lado, para consolidar un tejido industrial incipiente por otro. La premisa puede parecer sencilla, pero no era fácil de implementar. Llevar los valores del software libre a la economía. Desarrollar un nuevo modelo de negocio – un concepto del que tanto se habla – basado en la colaboración, en el conocimiento compartido frente a la especulación con el conocimiento adquirido, en la solidaridad frente a la rivalidad. Por las fechas ya intuirán que nacimos en plena crisis, en momentos complicados, con escasos recursos pero con mucha ilusión. Esos primeros años hicimos nuestro el proverbio inglés de «que ningún mar en calma hizo experto a un marinero». Era preciso soñar y creyendo en nuestros sueños hemos llegado hasta aquí. Pasado este tiempo, no nos olvidamos de seguir soñando.
Hoy, en 2024, la Asociación gvSIG es una entidad reconocida en todo el mundo. La tecnología derivada de un proyecto nacido, no lo olvidemos, en la periferia de Europa se utiliza en más de 160 países. Participamos y colaboramos con los principales foros y organizaciones que promueven las Ciencias Geográficas, el conocimiento abierto y la interoperabilidad. Hemos recibido premios internacionales de entidades como la NASA o la Comisión Europea, que el pasado año reconoció a gvSIG como el proyecto de software libre más importante de Europa. Hemos desarrollado una suite o catálogo de tecnologías libres que permiten abordar cualquier necesidad de gestión de información con dimensión geográfica, para cualquier organización. Colaboramos en proyectos de I+D+i con decenas de universidades, se multiplican las publicaciones científicas que citan el uso de gvSIG. Las redes sociales de gvSIG tienen una influencia notable con miles de seguidores. Y en relación a ese nuevo modelo de negocio del que hablábamos… hemos impulsado la consolidación de empresas españolas y desarrollado proyectos en más de 30 países para entidades de todo tipo, de Naciones Unidas a pequeños ayuntamientos, de grandes empresas privadas del sector de la energía a ONGDs. Somos, en definitiva, un centro de referencia a nivel internacional.
Nuestra historia por tanto pivota alrededor del conocimiento. Desarrollarlo para compartirlo, para reducir asimetrías entre territorios, para generar economía de calidad, para reafirmar a Antonio Machado cuando decía que «en cuestiones de cultura y saber, solo se pierde lo que se guarda; solo se gana lo que se da».
Quiero recordar una anécdota que refleja bien esta frase. Un ejemplo de esos otros valores, no cuantificables, que ocurren alrededor del modelo de conocimiento, desarrollo y negocio que impulsamos en la Asociación gvSIG.
En un evento organizado por Itaipú Binacional en Foz do Iguaçu, en Brasil, se nos invitó a dar cursos de formación tanto al personal de la central hidroeléctrica como, de manera abierta, a aquellos universitarios que quisieran asistir. En el primer curso de formación, un alumno y una alumna que se situaban en primera fila, preguntaron al formador (en este caso, era yo) si podía ponerles en contacto con los organizadores del evento para preguntar por un hospedaje económico. Entonces me contaron su historia…
En la Universidad de Asunción, Paraguay, donde ellos cursaban estudios, los alumnos en su conjunto habían solicitado al profesorado que les dieran formación en gvSIG, ya que consideraban que era una apuesta de futuro para el país el contar con ingenieros formados en tecnologías de software libre, con las ventajas que ello tiene. El profesorado, conocedor solo de productos no libres, se negó. Entre todos los estudiantes se decidió hacer una colecta que permitiera a uno y a una de ellos hacer el largo viaje a Foz do Iguaçu, formarse y así, al regresar, poder replicar la formación para todo el alumnado. Hoy día varios de esos alumnos tienen puestos de responsabilidad en el país.
Si hemos llegado hasta aquí es porque hay mucha gente que piensa que puede haber otros enfoques, otras maneras de hacer las cosas. Por eso, para acabar quiero agradecer a todas las personas que estuvieron, están o estarán en el proyecto gvSIG, trabajadores, entidades, comunidades… y muy especialmente a los compañeros y compañeras por su esfuerzo y compromiso, siempre se han puesto al servicio del proyecto y nunca han puesto el proyecto a su servicio. Nuestro futuro estará llenos de mapas, estándares, algoritmos y líneas de código, pero sobre todo de personas trabajando por un objetivo común. Muchas gracias.
-
sur GIScussions: W3W – It’sGetting.Better.AlltheTime
Publié: 28 June 2024, 2:36pm CEST
Excuse the corny title and associated video but I couldn’t resist it.
What3Words’s accounts for 2023 have just been published and the cynics who have doubted W3W’s commercial model were confounded by the outstanding progress that the company has made in 2023. Here are a few highlights to save you reading through 45 pages.
- Revenues surged by 28% to break through the £1m barrier for the first time
- Employee numbers fell from 152 to 128
- Admin expenses fell by 54% to £21.7m – “primarily driven by the reduction in consumer acquisition activities and the fair value adjustment relating to convertible loan notes” (That’s less advertising and what might be described as “debt swap magic”)
- The loss for the year fell by 48% to £16.4m
- The Directors consider W3W to be a going concern with cash and cash equivalents of £14.8 and term deposits of £12.8 at the end of the year which gives them well over a year’s runway at current revenue and expenditure levels.
- Raised £6.9m via a cash convertible loan instrument – it’s good to see that smart investors with a long term horizon continue to support W3W
- W3W has cumulative losses of £136m so when they do start to make profits in the near future the tax authorities will not be a beneficiary for several years.
You might think that summary was a bit dry so I asked a friendly AI to give me a slightly more positive view:
What3Words absolutely smashed it in 2023!Revenue rockets! They blasted past the £1 million mark for the first time, a whopping 28% increase. That’s impressive growth for any company, but for a young innovator like What3Words, it’s a sign of things to come!
Leaner, meaner, revenue machine! While the team size trimmed down slightly, they achieved amazing things. Admin expenses plummeted by 54%! This financial wizardry involved cutting back on marketing spend and some clever financial maneuvering. Talk about efficiency!
Losses slashed in half! The deficit shrunk by a mighty 48%, proving their business model is tightening its grip.
The future’s bright! With over £27 million in the bank and a year’s worth of runway at current spending, What3Words is well-positioned for continued success.
Smart money says “Yes!” Investors are clearly bullish! A cool £6.9 million was raised through a fancy loan thingy (cash convertible loan instrument, for those keeping score). This shows that big thinkers recognize the long-term potential of What3Words.
Taxman blues? Not anymore! With a hefty pile of past losses, What3Words gets a tax break for years to come. That’s more money to fuel their innovative ideas!
In short, 2023 was a phenomenal year for What3Words. They’re growing, they’re efficient, and they’ve got the financial backing to keep pushing boundaries. If you’re looking for a company on the rise, What3Words is a shining star!
PLEASE NOTE THAT THE ABOVE REVIEW IS NOT A FINANCIAL RECOMMENDATION!
-
sur GeoCat: GeoCat Bridge for ArcGIS Pro has arrived!
Publié: 28 June 2024, 12:39pm CEST
We are super excited to report that the very first official release of GeoCat Bridge for ArcGIS Pro is now available to all our customers.GeoCat Bridge for ArcGIS® Pro is an add-in for Esri’s leading desktop GIS application, that allows you to publish your maps and metadata to your open data space.
All users can try GeoCat Bridge for free using our demo server as your playground. You no longer need a trial license to discover the full potential of Bridge.
GeoCat Live or Enterprise customers can contact us to activate their complimentary GeoCat Bridge licenses, or migrate their old GeoCat Bridge for ArcMap license.
Some of the key features of GeoCat Bridge for ArcGIS Pro version 1.0 are:
- Publish ArcGIS feature and raster layers as GeoCat Map or GeoServer WMS, WFS, and WCS layers
- Publish layer metadata to a GeoCat Find or GeoNetwork catalog service (ISO 19139)
- Automatic links between the map and catalog service(s) to increase discoverability
- Automatic group layers
- Automatic metadata thumbnail generation, so the record looks good
- Convert ArcGIS layer symbology to SLD with GeoServer vendor options
- Preview generated SLD and export it as a style package, containing any referenced PNG or SVG images
- Browse GeoServer workspace contents and add WMS layers on-the-fly
- Create and delete GeoServer workspaces
- Publish whole maps as a workspace or publish selected layers to existing workspaces
For instructions and an overview of all the features this version has to offer, consult our documentation.
Try now Order nowTry out or buy GeoCat Bridge for ArcGIS Pro now and let us know what you think! We value your feedback and suggestions.
Stay tuned for future updates, as more features and improvements will be added!
The post GeoCat Bridge for ArcGIS Pro has arrived! appeared first on GeoCat bv.
-
sur Adam Steer: Cartography as code: Cartopy
Publié: 28 June 2024, 12:24pm CEST
This story calls back a long way to my mapping roots. I started out making scientific maps using the venerable Generic Mapping Tools (GMT) to plot bathymetry, ship tracks, sampling stations. Almost two decades later, I’m still making maps with code! However, this time it’s in Python – with some helpers. Here’s the end product… Read More »Cartography as code: Cartopy -
sur Mappery: New York, mosaic
Publié: 28 June 2024, 11:00am CEST
Matt Malone spotted this fantastic mosaic-tiled map of NYC ? at LaGuardia Airport during his first trip there last October. As a geographer, he said he was required to take a picture and share it.
MapsintheWild New York, mosaic
-
sur WhereGroup: Mapbender-Anwendungen einfach direkt aus QGIS heraus erstellen
Publié: 27 June 2024, 11:30am CEST
Mit unserem neuen Plugin für QGIS ist es nun möglich, QGIS-Desktop-Projekte mit nur ganz wenigen Schritten als WMS und gleichzeitig als Mapbender Anwendungen zu veröffentlichen. -
sur Mappery: Western Hemisphere
Publié: 27 June 2024, 11:00am CEST
This came from Moritz Schillinger
“This map painting is from David Hardy showing the western hemisphere (artist name Le Suisse Marocain – website [https:]] ). Not sure if it’s a Map in the Wild, it’s hardly recognizable. “
No worries about eligibility Moritz, our standards are very flexible.
MapsintheWild Western Hemisphere

-
sur Comparaison des solutions de collecte de terrain : QField et LandSurveyCodesImport (LSCI)
Publié: 27 June 2024, 7:11am CEST par Loïc Bartoletti
IntroductionChez Oslandia, nous offrons des services pour la gestion des réseaux, les collectivités et la production de plans de corps de rue simplifiés (PCRS). Parmi ceux-ci, nous proposons des assistances et développements pour les solutions de collecte de terrain. Dans le billet précédent, nous faisions état de ces solutions. Cet article explique les différences entre deux solutions de collecte : QFIELD et LandSurveyCodesImport (LSCI). Nous sommes, en même temps, partenaires d’OpenGIS.ch, éditeur de QField, et les développeurs de LandSurveyCodesImport (LSCI). Pourquoi proposer deux outils ?
QField : Modification directe des donnéesQField est une application mobile développée autour de QGIS. Conçue pour une utilisation intuitive sur le terrain, elle permet aux utilisateurs de :
- Modifier les données SIG en temps réel : les relevés et modifications peuvent être effectués directement sur le terrain et synchronisés immédiatement avec la base de données principale.
- Accès facile aux informations : les utilisateurs ont un accès direct aux cartes et aux données géospatiales, ce qui permet une prise de décision rapide et informée.
- Cartographie environnementale : des naturalistes peuvent utiliser QField pour relever des données sur la faune et la flore, mettant à jour instantanément la base de données.
- Gestion des infrastructures : les techniciens des services publics peuvent enregistrer et modifier les informations sur les infrastructures directement sur le terrain.
LandSurveyCodesImport (LSCI) est un plugin QGIS destiné principalement aux topographes. Il permet la saisie de points et de codes à partir de carnets de terrain, suivi d’un traitement et d’une intégration dans QGIS. Ce processus est particulièrement utile pour :
- La saisie structurée des données : les topographes peuvent enregistrer des points précis et des codes descriptifs, facilitant ainsi le traitement ultérieur des données.
- Intégration avec les outils de topographie traditionnels : compatible avec les stations totales et les appareils GNSS, LSCI facilite la transition des données de terrain vers le SIG.
- Topographie urbaine : les équipes de topographie peuvent collecter des données détaillées sur les structures urbaines et les intégrer facilement dans QGIS pour une analyse approfondie.
- Géodésie et levés cadastraux : les géomètres et topographes peuvent utiliser LSCI pour traiter les relevés topographiques et produire des cartes précises 3D.
LSCI s’intègre dans une suite d’outils spécialisés :
- TotalOpenStation : Utilisé pour la conversion des carnets de terrain en données numériques.
- Topaze : Outil de calcul topométrique pour une analyse détaillée des relevés.
Leurs utilisations conjointes permettent de créer une chaîne de traitement des données efficaces pour intégrer les données capteur GPS à la base de données.
Complémentarité des outilsBien que QField et LSCI semblent répondre à des besoins différents, ils peuvent être utilisés dans le même service pour une gestion complète des données de terrain. QField permet une mise à jour immédiate et directe des données, tandis que LSCI offre une solution structurée pour les relevés topographiques.
Contrôle qualité avec QompliGISEnfin, n’oublions pas de vérifier la donnée ! Pour cela, nous poussons QompliGIS qui est un outil pour le contrôle qualité des données SIG. Il permet de s’assurer que les plans produits sont conformes aux normes requises, garantissant ainsi la fiabilité et la précision des informations géospatiales.
ConclusionQField et LandSurveyCodesImport (LSCI) répondent à des besoins spécifiques pour la saisie terrain. Chez Oslandia, nous proposons notre expertise et nos services de développement pour intégrer ces solutions dans vos processus et répondre à vos exigences spécifiques.
Vous avez envie d’intégrer ces outils à vos SI ? Vous souhaitez co-développer de nouvelles fonctionnalités ? Contactez-nous !
-
sur Mappery: The Geographic Center of the United States is at …
Publié: 26 June 2024, 11:00am CEST
Ander Andersen is another new contributor. He kicks off with marker for the geographic center of the US. UK readers please forgive the US spelling of what should be “centre” but given the location I thought I should follow their convention.
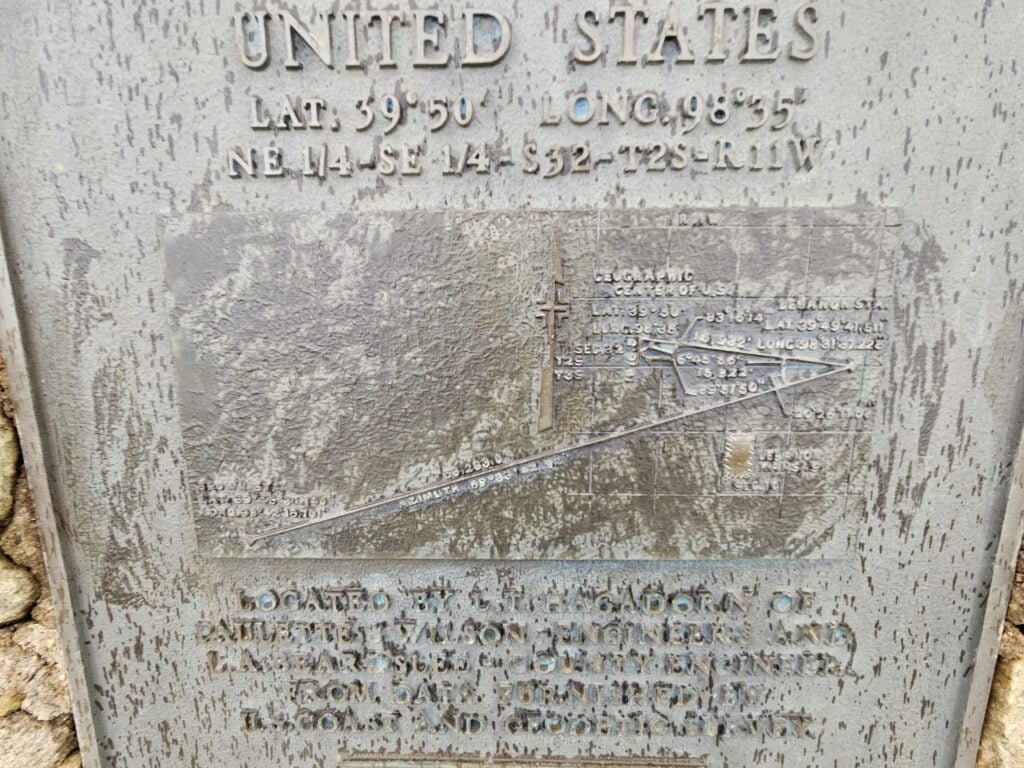
Of course anything that claims to be the geographic centre of a country or polygon is going to prompt some discourse in the geo community. The marker has Lat 39 degrees 50 minutes, Long 98,35 but, as you might expect Wikipedia has a whole article about the different options – this marker is at the centre of the 48 contiguous states and located Lebanon, Kansas
If you include Alaska and Hawaii the centre shifts to Lat 44,58, Long 103,56 which is north of Belle Fourche in South Dakota.
MapsintheWild The Geographic Center of the United States is at …
-
sur Mappery: Berlin, Schoneberg
Publié: 25 June 2024, 11:00am CEST

What a fantastic station signage! Marc-Tobias sent me this which he spotted on his way home from a recent Geomob Berlin event.

Note that it includes coordinates
MapsintheWild Berlin, Schoneberg
-
sur [Témoignage client] Sylvain Petiteau, géologue expert en contrôle géologique chez Orano
Publié: 25 June 2024, 7:07am CEST par Caroline Chanlon
Sylvain Petiteau est géologue de formation et géologue expert en contrôle géologique chez Orano. Après des missions au Kazakhstan, en Mongolie et au Niger, il travaille aujourd’hui sur l’estimation des ressources géologiques et le contrôle qualité des mineurs. Dans ce contexte Sylvain Petiteau collabore avec Oslandia sur le projet CanOP permettant d’identifier la teneur en uranium des minerais sur un site d’extraction au Niger.
Retour sur la collaboration :Il y a quelques années, nous avons initié un projet d’innovation CanOP qui s’est converti en projet d’industrialisation. Il s’agissait de remplacer une technologie ancienne sur un site minier de plus de 50 ans d’existence par un nouveau concept technologique. L’objectif était de nous aider à améliorer la sélectivité minière (notre capacité à séparer les roches minéralisées chargées en Uranium des roches stériles) notamment en ajoutant la géolocalisation aux mesures.
Le dispositif technique consiste en une perche métallique équipée de trois composants : deux cristaux qui effectuent des mesures de la radioactivité et un GPS différentiel avec une précision de l’ordre du millimètre.
Cette canne est connectée à une tablette en bluetooth qui envoie des informations géolocalisées de la mesure de la radioactivité. Les informations reçues par la tablette sont traitées par l’application CtrlCraft développée par Oslandia. Plusieurs cannes peuvent opérer en parallèle à différents endroits. Les données acquises sont ensuite regroupées et enregistrées dans une base de données centrale afin de suivre la production. Le croisement de ces données avec nos prévisions de production nous permet également d’améliorer nos modèles 3D de la teneur.
CanOP participe à la diminution de la co-activité. Une fois les mesures réalisées par les aides prospecteurs, ils peuvent se mettre en retrait de l’activité d’extraction pour guider à distance le travail de la pelle en suivant l’exploitation sur l’application CtrlCraft. On gagne énormément en sécurité.
Oslandia est disponible, à l’écoute et s’est bien adapté à nos demandes en conciliant les possibilités de développement, notamment de l’outil QGIS, aux besoins qu’on leur décrit. Le projet s’est monté en mode agile, la solution évoluant avec nos besoins. Nous avons de bonnes interactions avec Jacky notre interlocuteur principal sur le développement.
-
sur OPENGIS.ch: QGIS Swiss Locator 3.0 brings elevation profiles and vector tiles
Publié: 25 June 2024, 6:43am CEST
Swiss elevation profilesGet high-precision elevation profiles in QGIS right from Swisstopo’s official profile service, based on swissALTI3D data!
Swiss elevation profiles are available with QGIS 3.38.Thanks to this integration, you can take advantage of existing QGIS features, such as exporting 2d/3d features or distance/elevation tables, as well as displaying profiles directly in QGIS layouts.
Tip: Swiss elevation profiles will be available as long as the Swiss Locator plugin is installed and active. Should you need to turn Swiss elevation profiles off to create other profiles with your own data, go to the Plugin manager and deactivate the plugin in the meantime.
For developersWe’re paving the way for adding custom elevation profiles to QGIS. For that, we’ve added a QGIS profile source registry so that plugin developers can register their own profile sources (e.g., based on profile web services, just like we did here) and make them available for QGIS end users. The registry is available from QGIS 3.38. It’s your turn!

Thanks to the QGIS user group Switzerland for funding this feature!
Swiss vector tiles base maps
Loading Swiss vector tiles is now easier than ever. Just go to the locator bar, type the prefix “chb” (add a white space after that) and you’ll get a list of available and already styled Swiss vector tiles layers. Some of them will even load grouped auxiliary imagery for reference.
Vector tiles will be loaded at the bottom of the QGIS layer tree as base maps, so you will see all your data on top of them.
Vector tiles are optimized for local caching and scale-independent rendering. This also makes it a perfect fit for adding it to your QField project.
There are a couple of different vector tile sets available:
leichte-basiskarte Light base map
Similar to the leichte-basiskarte layer, but using an older version of the data source and adjusted styles.
 leichte-basiskarte-imagery (with WMTS sublayer)
 Imagery base map (with WMTS sublayer)
This layer is similar to the leichte-basiskarte-imagery layer, but it uses an older version of the data source and adjusted styles.
 Base map

See the official services documentation for details on data sources and styles.
FixesThanks to your feedback, we’ve also fixed some issues. Don’t hesitate to reach out to us at GitHub if you’d like to suggest or report something related to the Swiss Locator plugin.
Happy (and now more powerful) mapping!


-
sur Corpo d’été !
Publié: 24 June 2024, 11:35am CEST par Caroline Chanlon
Oslandia se veut une structure atypique, avec des valeurs affirmées basées sur l’autonomie, la confiance et l’ouverture.
Nous avons misé depuis la création d’Oslandia sur un fonctionnement en 100% télétravail avec des collaborateurs répartis dans la France entière. Pour une organisation libre des missions et de la journée de travail !
On a d’ailleurs évoqué le sujet du télétravail récemment dans un billet.Mais nous avons aussi grand plaisir à nous retrouver, c’était le cas en juin pour notre Corpo d’été :
Les Corpos sont l’occasion de partager des moments privilégiés et d’échanger sur des sujets de fonds. Pendant ces journées où nous avons de nouveau été magnifiquement accueillis à la Tour d’Oncin, nous avons plus spécialement travaillé sur notre offre de formation, fait des ateliers DuckDB, Dagster, PostGIS 3D, discuté de notre utilisation de l’IA ou des participations aux conférences …
Sans oublier les moments de partage autour d’une dégustation de vin AOC Bugey, une activité Escape Game ou encore le sauna du lieu !
-
sur Mappery: Norrebro Collection
Publié: 24 June 2024, 11:00am CEST
-
sur QGIS Blog: Plugin Update – December 23? to January 24?
Publié: 24 June 2024, 8:38am CEST
Between December 2023 and January 2024, 45 new plugins were published in the QGIS plugin repository. On top of those, we also included another 4 from the last week of November.
Here follows the quick overview in reverse chronological order. If any of the names or short descriptions catches your attention, you can find the direct link to the plugin page in the table below:
OpenLog High performance drillhole visualization QGIS module supporting 3D, cross-section, and log views. Benthic Terrain Modeler Analyzes benthic terrain for the purposes of classifying surficial seafloor characteristics that may be used in studies of benthic habitat, geomorphology, prediction of benthic fish species distribution, marine protected area design, and more QAnnAGNPS This plugin integrates the AnnAGNPS model into QGIS QSU2 QSU2 for CFD simulations Autofill Attributes Simple screen to fill your attributes table automatically. Eurostat downloader This plugin can be used to get data using the Eurostat API. VectorToDBLoader Loads Active Vector Themes to PostGIS, Oracle and MS SQL MunsellRGB Munsell code to sRBG conversion. WFS Styler Plugin Set a WMS style to a WFS layer CIGeoE Rename Attachment Attribute Rename attachment attribute of selected field on all features QGIS2API-CNIG Complemento que crea un visualizador cartográfico con el contenido del lienzo de QGIS Data Sources Panel Panel/dock with overview of layer data sources GeoFA Gratis og let adgang til GeoFA (Geografiske Fagdata i GeoDanmark) i QGIS.
Free and easy access to GeoFA (Geographical Professional Data in GeoDanmark) in QGIS.Co-Traveler Co-Traveler discovery tools. CoGEOS This plugin enables the user to automatically extract shorelines and compute shoreline change rates. Geovita GIS Processing provider This plugin adds different Geovita custom processing algorithms to QGIS CAV Este plugin realiza cálculos, comparações e análises estatísticas do volume e área de uma cota específica em um modelo digital de terreno. Whitebox Workflows for QGIS Provides access to Whitebox Workflows within QGIS Y!maptool?Yahoo! JAPAN YOLP Web API Yahoo!JAPAN?YOLP Web API??????????????????????????????????????????Web???? by Yahoo! JAPAN ?? [https:] This plugin allows the user to displays the location of search results using Yahoo!JAPAN YOLP Web API.You can search by zip code. QgisToUGCS A Plugin to create UGCS missions from GPKG layers. This is made for drone users that want to lead AreaScan for a drone-line inspection Infra3D plugin This plugin is an integration of the Infra3D application with QGIS CZML Moving Objects This plugin creates CZML files for moving objects described as points Layer Tree Tools Sorts and groups nodes in layer tree, takes layer tree snapshots Localisation Grand Lyon Suite d’outils de localisation utilisés pour les logiciels métiers QGIS de la Métropole Grand Lyon. FIM Forest Inventory and Monitoring Point Cloud Filter Slider GUI panel to change values in simple query builder filter for point clouds. Dokumente verknüpfen With this Plugin documents can be connected to objects. It is designed for sewer system inspection data. Bunting Labs AI Vectorizer Intelligent autocomplete for vectorizing raster maps. CIGeoE Pacman Resolve the intersection of 2 polygons by removing the overlapped area in the second polygon. GSI-AddressSearch ??????API?????????????????????????????????????????????????????????????API?? [https:] plugin allows the user to search for a address and get its coordinates using GSI API. Riverscapes Viewer Explore symbolized Riverscapes projects Feature Z Setter Sets the Z value of each new/edited feature to a specific value, based on a DEM layer plus an offset. BrandGIS BrandGIS Ledningsstöd och geografisk lägesbild vid brand i skog och mark. Oemc Plugin This plugin provides easy access to OEMC STAC catalog Swedigarch Geotools Swedigarch Geotools Urbantracer Urbantracer creates urbanized area polygon over a street map. Geohash Expressions Plugin This plugin adds four expression functions to work with geohash in the field calculator QMetadataLayerHISPANIA Complemento para visualizar y agregar metadatos a las capas. Mesh Flow Tool to extract flow from hydraulic model results contained in a mesh layer. QRiS QGIS Riverscapes Studio (QRiS) SAGis Excel Export Plugin öffnet einen vereinfachten Excel-Export-Dialog SAGis ALKIS Suche Plugin zum Einbinden und Durchsuchen einer ALKIS-Datenbank LandXML to Mesh Conversion of LandXML to Mesh and vice versa QuickCopy Click and Copy WKT. Style to text Converts stylefiles to csv-files R-ABLE plugin R-ABLE plugin, developed within the EUHubs4Data project, providing access to the web services on agricultural land. Python Module Manager Show all the installed packages (distributions); Show modules in a selected package; Install a package/packages; Load a module and get the version. PDD-QGis Tool Tool to download and visualize datasets from Plataforma de Datos by Itrend. Project Full Text Search This plugin generates a full text search index containing all attributes of all layers of a loaded project. The user then can use a single text-input field to search within all available attributes. -
sur Mappery: You are on the Plate
Publié: 23 June 2024, 11:00am CEST
Reinder spotted this plate in a shop window in The Hague.
“Shop window, Piet Heinstraat, The Hague, Netherlands. The spot where one can see this little scene is actually on the plate, down on the right hand side.”

MapsintheWild You are on the Plate
-
sur Mappery: Map Mannequin in Paris
Publié: 22 June 2024, 11:00am CEST

Moritz Schillinger joins the club of Maps in the Wild contributors with his first post of this superb map mannequin.
“Last weekend in Paris I discovered a map in the wild myself. I found these artworks in the art center “59 Rivoli”, a former squat which now hosts really cool (temporary) art studios.
The map mannequin here is from Isabelle Marty (artist’s name @i.m.arty – Instagram). What I can see is that she’s wearing pieces of France, Ireland and the Netherlands. “
Welcome to the club Moritz, keep them coming!

MapsintheWild Map Mannequin in Paris
-
sur Mappery: Kids on the Map
Publié: 21 June 2024, 11:00am CEST

Reinder sent us this pic from the Maritime Museum in Rotterdam
“The Maritime Museum in Rotterdam has taken the next step in the field of target group approach and public outreach using the Cultural Target Group Model. “This has given us a shared language and a shared image of our Cultural Target Groups. And more awareness about its importance,” says Layla Salamoun, Head of Marketing, Communications & Development.”
Seems that giant maps that you can walk on, play on and explore are appear.ing quite often on Mappery, send us more – we love them!
MapsintheWild Kids on the Map

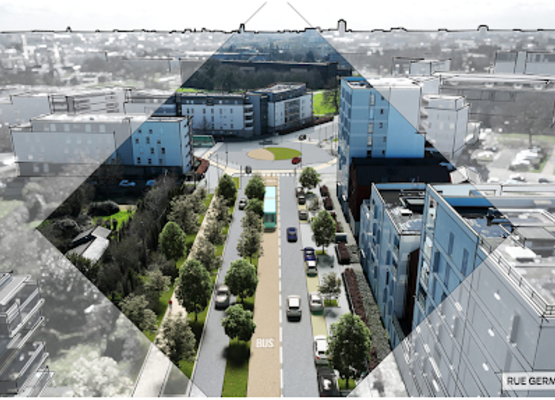
-
sur Question du mois chez Oslandia : Quel est mon intérêt à financer de l’open source ?
Publié: 21 June 2024, 6:24am CEST par Caroline Chanlon
Chez Oslandia, nous croyons fermement aux multiples avantages du financement de l’open source. Voici quelques éléments clés qui mettent en lumière les raisons pour lesquelles cela constitue une stratégie judicieuse pour toute organisation :
Orienter la roadmapEn finançant des projets open source (développement de fonctionnalités, corrections de bugs…), vous avez la possibilité d’influencer la feuille de route du développement. Vos besoins spécifiques sont mieux pris en compte, assurant ainsi que les évolutions du projet répondent à vos attentes.
Maintenance optimiséeL’un des grands avantages de l’open source est que la maintenance et les améliorations futures sont prises en charge par l’ensemble des contributeurs de façon mutualisée. Cela réduit la charge de travail globale, et particulièrement la charge de maintenance interne du code produit par votre financement, et assure ainsi une évolution continue du logiciel en respectant le niveau de qualité attendu.
Visibilité et communicationEn contribuant financièrement à l’open source, vous bénéficiez d’une visibilité accrue. Les contributions sont relayées au sein des communautés, offrant ainsi une publicité positive et renforçant votre image de marque, tant auprès de la communauté qu’auprès des autres organisations utilisatrices. Cette communication produit également un effet « boule de neige » où d’autres organisations suivront votre exemple, et vous bénéficierez de leurs financements dans le futur.
Reconnaissance communautaireLa reconnaissance par la communauté open source est un atout majeur. Être perçu comme un acteur clé et un soutien de l’open source peut renforcer votre crédibilité et votre influence, solidifiant l’écosystème de votre socle technologique. Cette reconnaissance facilite par la suite les échanges avec la communauté et les réponses que celle-ci pourra apporter à vos problématiques.
Avantages RHEnfin, investir dans l’open source est un levier important pour attirer et retenir les talents. Les développeurs sont attirés par des entreprises engagées dans l’open source, perçues comme innovantes, tournées vers l’avenir et porteuses de sens dans le travail.
En conclusion, financer l’open source n’est pas seulement une question de philanthropie technologique, c’est aussi une stratégie d’entreprise solide qui apporte de nombreux bénéfices tangibles. Chez Oslandia, nous sommes fiers de promouvoir et de soutenir l’open source, car nous croyons en son potentiel à transformer positivement les pratiques et les technologies. C’est aussi le cas de nos clients et partenaires, et ensemble nous faisons progresser les technologies du libre, le bien commun, le tout avec une raison d’être au travail que nous fournissons.
-
sur Mappery: Giant China Map in Zaragoza
Publié: 20 June 2024, 11:00am CEST
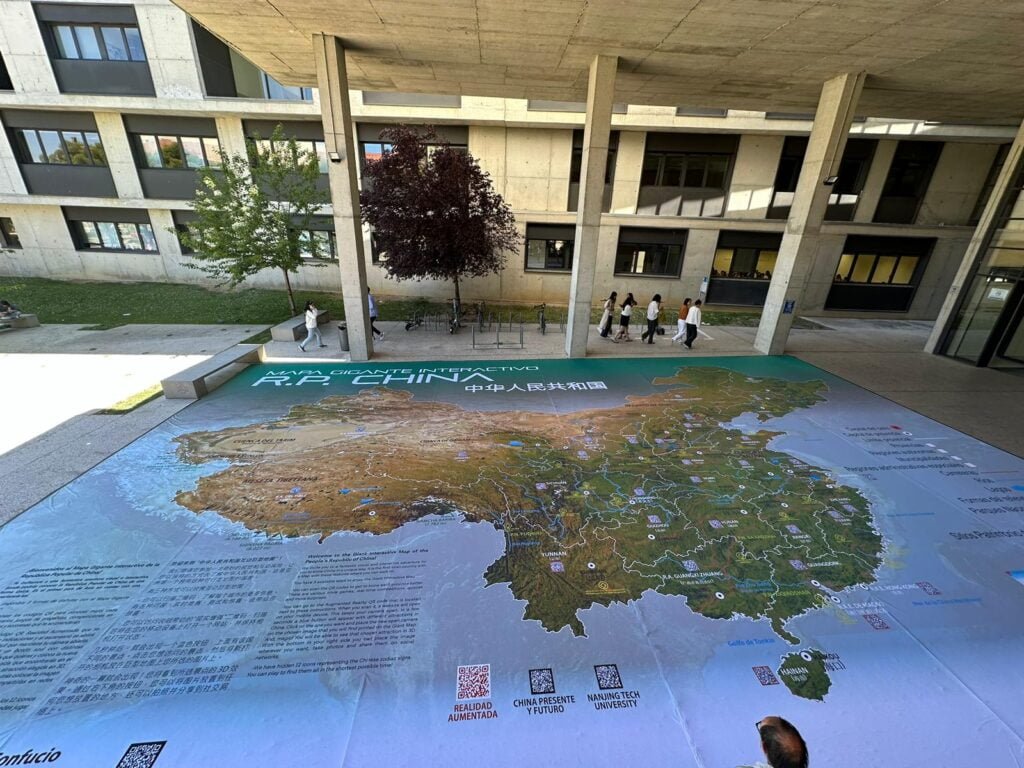
Angel Arenas sent us his latest project. It’s a giant interactive map of China at the University of Zaragoza. The scale of these maps is so impressive, a whole class or more could explore.
MapsintheWild Giant China Map in Zaragoza
-
sur [Equipe Oslandia] Gwendoline, développeur QGIS web
Publié: 20 June 2024, 6:59am CEST par Caroline Chanlon
Ingénieur à l’INSA de Lyon en bio-informatique, Gwendoline ne souhaite pas aller vers une thèse et s’oriente dans le domaine du séquençage ADN. Une spécialité qui l’amène vers sa première expérience professionnelle au CNRS dans une station marine à Roscoff en Bretagne.
Elle travaille au service informatique, en appui aux chercheurs et participe au développement d’un logiciel d’interfaçage « clic – bouton » avec les outils lignes de commande, pour proposer un outil aux chercheurs leur permettant de répéter les workflows rapidement sur un autre jeu de données et les rendre accessibles dans le cadre des publications scientifiques.
« Je devais comprendre les biologistes pour transmettre les besoins aux informaticiens, mes compétences en bio-informatique et en informatique m’ont bien aidées ! «
Après 3 ans et demi au CNRS, direction la région PACA et la Société du Canal de Provence au service informatique !
Pendant 5 ans, Gwendoline travaille sur de nombreux projets : évolution d’un plugin QGIS en Python pour générer des cahiers parcellaires, mise en place d’IDG, de requêtes PostGIS, d’applications de relevés sur le terrain et de plein d’autres plugins !
« En cherchant des informations sur un logiciel, je suis tombée sur un article d’Oslandia, je me suis plus renseignée et vu que des postes étaient ouverts ! «
Gwendoline est développeur QGIS web chez Oslandia depuis 2021. Elle a pour mission le développement de projets autour de QWC comme pour WKN, mais aussi dans le cœur QWC, dans le cadre de missions open source, ainsi que la formation QGIS / PostGIS et QWC.
Projet emblématiqueLa traduction de l’interface d’administration de QWC ! C’est quelquechose que je ne fais jamais ! C’était un travail de fourmi qui apporte une grande satisfaction quand c’est finalisé !
Technologie de prédilection
A retrouver sur : [https:]]
et la documentation pour l’activer : [https:]]Python !
Sa philosophieD’un bout à l’autre ! J’aime maîtriser toute la chaîne : du besoin client jusqu’à la documentation !
Oslandia en 1 motBienveillance entre collègues et aussi au niveau des clients, on fait toujours au plus juste, avec une volonté de les former, pour les rendre autonomes.
-
sur Marco Bernasocchi: QGIS.ch user-day 2024 – A biased review by uber-happy committers
Publié: 20 June 2024, 6:45am CEST
During the pandemic, people noticed how well they could work remotely, how productive meetings via video call could be, and how well webinars worked. At OPENGIS.ch, this wasn’t news because we have always been 100% remote. However, we missed the unplanned, in-person interactions that occur during meetups with a
 or
or  . That’s why we’re very pleased that last week we could join the Swiss QGIS user day for the second time after the pandemic.
OPENGIS.ch has been invested in QGIS since its inception in 2014, actually even before; our CEO Marco started working with QGIS 0.6 in 2004 and our CTO Matthias with version 1.7 in 2012. Since 2019, we have also been the company with the most core committers. We can definitely say that OPENGIS.ch has been one of the main driving forces behind the large adoption of QGIS in Switzerland and worldwide.
 Contributions to the QGIS core measured in commit numbers
Looking at the work done in the QGIS code we’re by far the most prolific company in Switzerland and second worldwide only to North Road Consulting. On top of it, we were the first – and still only one of two- companies to sustain QGIS.org at a Large level since 2021.
This makes us very proud and it is why we’re even happier to see how much that is happening around QGIS in Switzerland aligns with the visions and goals we set out to reach years ago.
The morning started with a presentation by our CTO Matthias “What’s new in QGIS” featuring plenty of work sponsored by the Anwendergruppe CH.
 Our CTO Matthias answering QGIS questions
DXF Improvements, the release of SwissLocator 3.0 with swissalti3d and vector tiles integration, and an update on the advances towards solid curve handling in QGIS, a prerequisite for properly handling AV data in Switzerland, were only some of the many noteworthy points he touched.
The highlight of Matthias’ presentation was the better OGC API Features support in QGIS, which was also highlighted in a subsequent talk about Kablo, showing how the next generation of industry solutions (Fachschalen) will be implemented.
Slides: Neues aus der QGIS Welt - QGIS Anwendertag 2024Following was a short presentation on the project DMAV, Christoph Lauber introduced a project that aims to implement an industry solution for official cadastral surveying with QGIS.
Adrian Wicki of the Federal Office for the Environment (FOEN) and Isabel presented how OPENGIS.ch and the partners Puzzle and Zeilenwerk help the FOEN with the SAM project with assess the hazards of flood, forest fire, or landslides, and warn authorities and the population. With an agile project organisation, the complex project succeeds in fulfilling requirements by applying user-centred development concepts. QGIS is used for visualizing and analyzing data and helping forecasters gain insights into the current situation.
Slides: BAFU_SAMAndreas Neumann from ETH Zurich and Michael presented the qgis-js project. QGIS-js is an effort to port QGIS core to WebAssembly so that it can be run in a web browser. Although still in the early experimentation phase, this project has great potential to leverage interesting new use cases that weren’t even thinkable before.
Slides: [https:]]Olivier Monod from the City of Yverdon presented Kablo, an electricity management proof of concept of the next generation implementation for industry solutions developed in collaboration with OPENGIS.ch.
By applying a middleware based on OGC API Features and Django, Kablo shows how common limitations of current industry solutions (like permission management and atomic operations) can be overcome and how the future brings desktop and web closer together.
Slides: kablo-qgis-user-daysObviously, it wasn’t just OPENGIS.ch. Sandro Mani from Sourcepole presented the latest and greatest improvements on QWC2, like street view integration and cool QGIS features brought to a beautiful web gis. Andreas Schmid from Kt. Solothurn presented how cool cloud-optimized geotiff (COG) is and what challenges come with it. Interested in the topic? Read more in our report about cloud optimized formats. Mattia Panduri from Canton Ticino explained how they used QGIS to harmonise the cantonal building datasets and Timothée Produit from IG Group SA presented how pic2map helps bring photos to maps.
To round up the morning, Nyall Dawson from North Road Consulting did a live session around the world to show the latest developments around elevation filtering in QGIS.
In the afternoon, workshops followed. Claas Leiner led a QGIS expression one while Matthias and Michael showed how to leverage QGIS processing for building geospatial data processing workflows.
The first QGIS model baker user meeting took place in the third room. The participants discussed this fantastic tool we developed to make INTERLIS work smarter and more productive.
 First ModelBaker user meeting
It was a very rich and constructive QGIS user day. We came home with plenty of new ideas and a sense of fulfilment, seeing how great the community we observed and helped grow has become.
A big thanks go to the organisers and everyone involved in making such a great event happen. Only the beer in the sunshine was literally watered by the rain. Nevertheless, there were exciting discussions in the station bistro or in the restaurant coaches on the way home.
See you next time and keep contributing

-
sur Markus Neteler: GRASS GIS 8.4.0RC1 released
Publié: 19 June 2024, 12:18pm CEST
The GRASS GIS 8.4.0RC1 release provides more than 515 improvements and fixes with respect to the release 8.3.2. Please support us in testing this release candidate.
The post GRASS GIS 8.4.0RC1 released appeared first on Markus Neteler Consulting.
-
sur Mappery: Japanese Garage Door
Publié: 19 June 2024, 11:00am CEST

Marc-Tobias spotted this map on a garage door in Yuigahama beach, Kamakura, Japan, [https:]] (beach), part of [https:]]
??????????????
means “For a safe and secure community”???
means Kamakura (city)
I’m left wondering why someone would want this map on their garage door, but I’m glad they did
MapsintheWild Japanese Garage Door
-
sur GeoTools Team: GeoTools 29.6 Released
Publié: 18 June 2024, 8:19pm CEST
GeoTools 29.6 releasedGeoTools team is providing a release of GeoTools 29.6:geotools-29.6-bin.zipgeotools-29.6-doc.zipgeotools-29.6-userguide.zipgeotools-29.6-project.zipThis is an unscheduled release provided to help teams address CVE-2024-36404. Details of this issue will be made available at the end of the month. This is in keeping with our coordinated vulnerability disclosure policy  -
sur GeoTools Team: GeoTools 31.2 Released
Publié: 18 June 2024, 8:19pm CEST
GeoTools 31.2 released The GeoTools team is pleased to announce the release of the latest maintenance version of GeoTools 31.2: geotools-31.2-bin.zip geotools-31.2-doc.zip geotools-31.2-userguide.zip geotools-31.2-project.zip This release is also available from the OSGeo Maven Repository and is made in conjunction with GeoServer 2.24.4 -
sur Mappery: Destination East Finchley
Publié: 18 June 2024, 11:00am CEST
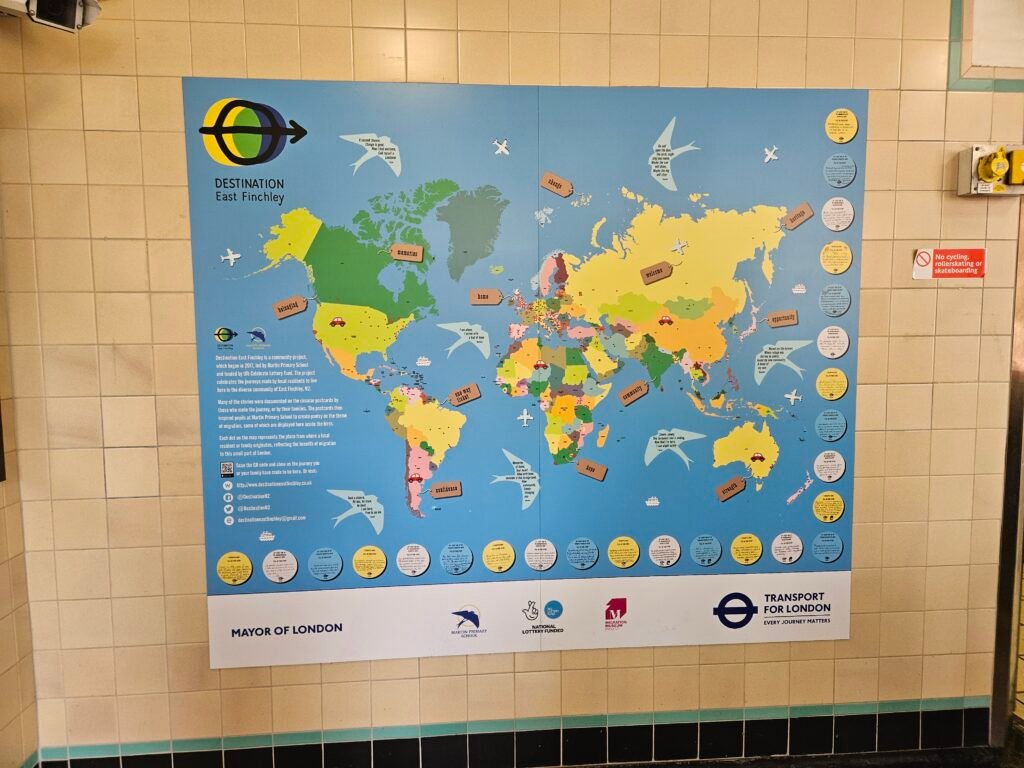
Anthony spotted this at East Finchley underground station.
The blurb says:
“Destination East Finchley is a community project, which began in 2017, led by Martin Primary School and funded by the Celebrate Lottery Fund. The project celebrates the journeys made by local residents to live here in the diverse community of East Finchley, N2.
Many of the stories were documented on the circular posterds by those who made the journey, or by their families. The postcards then inspired pupils at Martin Primary School to create poetry on the theme of migration, some of which are displayed here inside the birds.
Each dot on the map represents the place from where a local resident or family originates, reflecting the breath of migration to this small part of London. More InfoMapsintheWild Destination East Finchley
-
sur Bruxelles Environnement / Accompagnement technique pour la mise en œuvre des politiques régionales liées à l’environnement
Publié: 18 June 2024, 7:05am CEST par Caroline Chanlon
Bruxelles Environnement est un organisme public de la région de Bruxelles-Capitale chargé de concevoir et de mettre en œuvre les politiques régionales dans toutes les matières liées à l’environnement.
À ce titre, Bruxelles Environnement publie un certain nombre de données en opendata, notamment en exposant des flux OGC sur sa plateforme.
Oslandia l’accompagne sur :- l’administration et le maintien en condition opérationnelle des bases de données PostGIS. Cela implique notamment les migrations de versions majeures de PostgreSQL et PostGIS
- la configuration, le déploiement, l’administration et le MCO des serveurs de cartographie : MapServer, QGIS Server, via Docker, GitLab CI/CD et Ansible.
Oslandia accompagne également Bruxelles Environnement en proposant des sessions de formations sur PostgreSQL / PostGIS depuis plus de 10 ans. Avoir les compétences en interne a toujours été un choix de l’organisme pour garder de l’expertise au sein de l’équipe SIG.
Les sessions de formations ont lieu annuellement et se divisent en 2 parties.
La première pour des débutants ayant peu ou jamais touché aux notions de bases de données spatiales. L’enjeu est important ici, comme pour toutes formations débutants, en plus de donner les bases de compréhension, il faut arriver à motiver les utilisateurs et leur démontrer l’intérêt de la chose.
La seconde, pour des utilisateurs déjà expérimentés, permet d’approfondir leurs connaissances et elle est souvent données à la carte: les participants choisissent le programme et viennent souvent avec des questions très précises.Avoir la compétence en interne permet le lien avec notre assistance en parallèle. La bonne communication est primordiale, et parler le même langage est forcément un atout. L’assistance permet aussi à Bruxelles Environnement d’être aidé pour la mise en place en production de points abordés en formation et d’approfondir des utilisations avancées.
-
sur Marco Bernasocchi: Supercharge your fieldwork with QField’s project and app-wide plugins
Publié: 18 June 2024, 6:45am CEST
This blog post will introduce QField’s brand new plugin framework and walk through the creation of a plugin to support bird watchers in need of a quick way to digitize photos of spotted birds onto a point vector layer.
QField Plugin Snap! in action A plugin framework is born!As announced recently, QField now empowers users through a brand new plugin framework allowing for simple customization on the way the application behaves or looks all the way through to creating completely new functionalities.
The plugin framework relies on Qt’s QML engine and JavaScript, allowing for cross-platform support out of the box. This means that plugins will run perfectly fine on all platforms currently supported by QField: Android, iOS, Windows, Linux, and macOS.
App-wide plugin vs. project pluginFirst, let’s look at the two types of plugins supported by QField: app-wide plugins and project plugins. As their names imply, the main difference is their scope. An enabled app-wide plugin will remain active as long as QField is running, while project plugins are activated on project load and deactivated when the project tied to the plugin is closed.
Project plugins are shipped alongside a given project file (
.qgs/.qgz). Project plugins must share the same name of the project file with a.qmlextension. For example, if your project file isbirdwatcher.qgz, QField will look for the presence of abirdwatcher.qmlto activate the project plugin. For app-wide plugins, installation is done via the plugins manager popup; more on this below.Distribution of project plugins can be greatly facilitated through QFieldCloud. The presence of project plugins within a cloud project environment will be automatically detected and packaged alongside the project file and its datasets when deployed to QField devices.
Starting with a project pluginWe will start with looking into a simple project plugin that offers a new digitizing mechanism focused on snapping photos as a trigger for point feature addition. This plugin will demonstrate how new functionalities and behaviors can be added to QField to serve specific needs. In this case, the new digitizing mechanism could come in handy for bird watchers and other users in need of a quick way to snap photos!
It’s advised to download a version of QField running on your desktop environment while testing plugins. Links to Windows, Linux, and macOS builds are available here. Once installed, download this project archive containing a tiny birdwatcher sample project and extract it into a new directory on your local machine.
The project archive consists of a point vector layer (
observations.gpkg), a project file (birdwatcher.qgz) as well as a project plugin (birdwatcher.qml) which we will look into below. Please note that the point vector layer’s attribute form is already configured to display captured photos. We will not spend time on attribute form setup in this post; see this relevant documentation page if you are interested in knowing how that was achieved.
We can now test the project plugin by opening the project (
Digging into the project plugin filebirdwatcher.qgz) in QField. Users familiar with QField will notice a new ‘camera’ tool button present on the top-right corner of the map canvas. This button was added by the project plugin. You can press on it, to open the QField camera, take a photo (of yourself, a random object on your table, or with a bit of luck a bird), and witness how that leads to a point feature creation.Let’s open the project plugin file (birdwatcher.qml) in your favorite text editor. The first few lines define the QML imports needed by the plugin:
import QtQuick
import QtQuick.Controls

import org.qfield
import org.qgis
import Theme

import "qrc:/qml" as QFieldItems
Beyond the two QtQuick imports, we will make use of QField-specific types and items as well as QGIS ones (registered and declared in this source file), a Theme to retrieve icons and colors as well as QField items such as tool buttons (see this source directory), as well as the QField QML items embedded into the application itself to make use of the camera.
The next line declares an generic Item component which will be used by QField to initiate the plugin. This must be present in all plugins. As this plugin does, you can use the
Component.onCompletedsignal to trigger code execution. In this case, we are using iface to add a tool button on top of the map canvas:Component.onCompleted: { iface.addItemToPluginsToolbar(snapButton) }Just above these lines, the plugin declare a number of properties pointing to items found in the main QField ApplicationWindow:
property var mainWindow: iface.mainWindow()
property var positionSource: iface.findItemByObjectName('positionSource')
property var dashBoard: iface.findItemByObjectName('dashBoard')
property var overlayFeatureFormDrawer: iface.findItemByObjectName('overlayFeatureFormDrawer')
Users can reach through to any items within QField’s ApplicationWindow provided they have an objectName property defined. The string value is used in the
iface.findItemByObjectName()function to retrieve the item.The rest of the file consists of a loader to activate the QField camera, a tool button to snap a photo, and a function to create a new feature within which the current position is used as geometry and the snapped photo is attached to the feature form.
The function itself provides a good example of what can be achieved by using the parts of QGIS exposed through QML, as well as utility functions and user interface provided by QField:
function snap(path) {
  let today = new Date()
  let relativePath = 'DCIM/' + today.getFullYear()
                              + (today.getMonth() +1 ).toString().padStart(2,0)
                              + today.getDate().toString().padStart(2,0)
                              + today.getHours().toString().padStart(2,0)
                              + today.getMinutes().toString().padStart(2,0)
                              + today.getSeconds().toString().padStart(2,0)
                              + '.' + FileUtils.fileSuffix(path)
  platformUtilities.renameFile(path, qgisProject.homePath + '/' + relativePath)

  let pos = positionSource.projectedPosition
  let wkt = 'POINT(' + pos.x + ' ' + pos.y + ')'

  let geometry = GeometryUtils.createGeometryFromWkt(wkt)
  let feature = FeatureUtils.createFeature(dashBoard.activeLayer, geometry)

  let fieldNames = feature.fields.names
  if (fieldNames.indexOf('photo') > -1) {
    feature.setAttribute(fieldNames.indexOf('photo'), relativePath)
  } else if (fieldNames.indexOf('picture') > -1) {
    feature.setAttribute(fieldNames.indexOf('picture'), relativePath)
  }

  overlayFeatureFormDrawer.featureModel.feature = feature
  overlayFeatureFormDrawer.state = 'Add'
  overlayFeatureFormDrawer.open()
}
The QGIS API Documentation site is a good resource for learning what parts of the many QGIS classes are exposed to QML. For example, the QgsFeature documentation page contains a Properties section and a Q_INVOKABLE prefix next to functions indicating their availability within a QML/JavaScript environment.
Deployment of a project plugin via QFieldCloudAs mentioned above, QFieldCloud greatly eases the deployment of project plugins to devices in the field. We will now go through the steps required to create a cloud project environment based on the birdwatcher sample project, and witness it handling the project plugin automatically.
This will require you to registered for a freely available QFieldCloud community account if you haven’t done so yet (it takes a minute to do so, what are you waiting for
 ). We will also need the QFieldSync plugin in QGIS, which can be enabled through the QGIS plugin manager.
Let’s open QGIS, and log into QFieldCloud by clicking on the QFieldSync toolbar’s blue cloud icon. Once logged in, click on the ‘Create New Project’ tool button found at the bottom of the dialog.

In the subsequent panel dialog, choose the ‘Create a new empty QFieldCloud project’ and then hit the ‘Next’ button. Give it a name and a description, and for the local directory, pick the folder within which you had extracted the birdwatcher project, then hit the ‘Create’ button.

QFieldSync will then ask you to upload your newly created cloud project environment to the server. Notice how the project plugin file (birdwatcher.qml) is part of the files to be delivered to the cloud. Confirm by clicking on the ‘Upload to server’ button.

When QFieldSync is finished uploading, you are ready to take your mobile device, open QField, log into your QFieldCloud account and download the cloud project. Once the cloud project is loaded, you will be asked for permission to load the project plugin, which you can grant on a permanent or one-time basis.
Bravo! You have successfully deployed a project plugin through QFieldCloud.
Creating an app-wide plugin directoryLet’s move on to creating a functional app-wide plugin directory. Download this sample app-wide plugin and extract it into a new directory placed in the ‘plugins’ directory, itself found within the QField app directory. The location of the app directory is provided in the ‘About QField’ overlay, take note of it prior to extracting the plugin if you have not done so yet.

As seen in the screenshot above, which demonstrates the directory hierarchy, a given plugin directory must contain at least two files: a main.qml file, which QField will use to activate the plugin, and a metadata.txt file containing basic information on the plugin, such as the plugin name, author details, and version.
Here’s a sample metadata.txt from the birdwatcher project plugin upgraded into an app-wide plugin:
[general]
name=Snap!
description=Digitize points through snapping photos
author=OPENGIS.ch
icon=icon.svg
version=1.0
homepage=https://www.opengis.ch/
Opening main.qml in your favourite text editor will reveal that it has the exact same content as the above-shared project plugin. The only change is the renaming of birdwatcher.qml to main.qml to take into account this plugin’s app-wide scope.
PSA: we have setup this GitHub QField template plugin repository to ease creation of plugins. Fork at will!
Deploying app-wide pluginsWhile currently not as smooth as deploying a project plugin through QFieldCloud, app-wide plugins can be installed onto devices using a URL pointing to a zipped archive file containing the content of a given plugin directory. The zipped archive file can then be hosted on your own website, on a GitHub or GitLab repository, a Dropbox link, etc.
In QField, open the plugins manager popup found in the settings panel, and use the ‘Install plugin from URL’ button to paste a URL pointing to a zipped plugin file.

You should keep the zipped archive file name consistent for a better user experience, as it is used to determine the installation directory. This is an important consideration to take into account when offering plugin updates. If your zipped plugin file name changes, the plugin will not be updated but rather added to a new directory alongside the previously installed plugin.
QField does allow for a version tag to be added to a zipped archive file name, provided it is appended at the end of the file name, preceded by a dash, and includes only numbers and dots. For example, myplugin-0.0.1.zip and myplugin-0.2.1.zip will install the plugin in the myplugin directory.
Empowering users as well as developersHere at OPENGIS.ch, we believe this new plugin framework empowers not only users but also developers, including our very own ninjas! With plugin support, we now have the possibility to develop answers to specific field scenarios that would not necessarily be fit for QField-wide functionalities. We would love to hear your opinion and ideas.
If you would like to supercharge your fieldwork and need some help, do not hesitate to contact us – your projects are our passion

P.S. If you are developing a cool QField plugin, also let us know!
Bird SVG in video CC-BY [https:]] -
sur GeoServer Team: GeoServer 2.25.2 Release
Publié: 18 June 2024, 2:00am CEST
GeoServer 2.25.2 release is now available with downloads (bin, war, windows), along with docs and extensions.
This is a stable release of GeoServer recommended for production use. This release is made ahead of schedule to address an urgent bug or security vulnerability (see CVE-2024-36401 below). GeoServer 2.25.2 is made in conjunction with GeoTools 31.2, and GeoWebCache 1.25.2.
Thanks to Jody Garnett (GeoCat) for making this release on behalf of GeoCat customers.
Security ConsiderationsThis release addresses security vulnerabilities and is considered an essential upgrade for production systems.
- CVE-2024-36401 Critical
- CVE-2024-34696 Moderate
- CVE-2024-35230 Moderate
- CVE-2024-24749 Moderate
The details of this vulnerability will be made available at the end of the month providing an opportunity to update.
The use of the CVE system allows the GeoServer team to reach a wider audience than blog posts. See the project security policy for more information on how security vulnerabilities are managed.
Demo Requests page rewrittenThe Demo Request page has been rewritten to use JavaScript to issue POST examples. This provides a much better user experience:
- Show Result lists the response headers to be viewed along side the returned result (with an option for XML pretty printing).
- Show Result in a New Page is available to allow your browser to display the result.
The WCS Request Builder and WPS Request Builder demos now have the option to show their results in Demo Requests page. Combined these changes replace the previous practice of using an iframe popup, and have allowed the TestWfsPost servlet to be removed.
For more information please see the Demo requests in the User Guide.
Thanks to David Blasby (GeoCat) for these improvements, made on behalf of the GeoCat Live project.
- GEOS-11390 Replace TestWfsPost with Javascript Demo Page
New Feature:
- GEOS-11390 Replace TestWfsPost with Javascript Demo Page
Improvement:
- GEOS-11351 Exact term search in the pages’ filters
Bug:
- GEOS-7183 Demo request/wcs/wps pages incompatible with [HTTPS]
- GEOS-11416 GeoPackage output contains invalid field types when exporting content from PostGIS
- GEOS-11430 CiteComplianceHack not correctly parsing the context
Task:
- GEOS-11411 Upgrade to ImageIO-EXT 1.4.11
- GEOS-11426 Rework community dependency packaging to use module’s dependencies
- GEOS-11429 Split COG community module packaging based on target cloud provider
- GEOS-11432 Upgrade to ImageIO-EXT 1.4.12
For the complete list see 2.25.2 release notes.
Community UpdatesCommunity module development:
- GEOS-11412 Remove reference to JDOM from JMS Cluster (as JDOM is no longer in use)
- GEOS-11413 STAC uses inefficient dabase queries when asking for collections in JSON format
Community modules are shared as source code to encourage collaboration. If a topic being explored is of interest to you, please contact the module developer to offer assistance.
About GeoServer 2.25 SeriesAdditional information on GeoServer 2.25 series:
-
sur GeoServer Team: GeoServer 2.24.4 Release
Publié: 18 June 2024, 2:00am CEST
GeoServer 2.24.4 release is now available with downloads (bin, war, windows), along with docs and extensions.
This is a maintenance release of GeoServer providing existing installations with minor updates and bug fixes. It also includes security vulnerability fixes.
GeoServer 2.24.4 is made in conjunction with GeoTools 30.4, and GeoWebCache 1.24.4.
Thanks to Peter Smythe (AfriGIS) for making this release.
Security ConsiderationsThis release addresses security vulnerabilities and is considered an essential upgrade for production systems.
- CVE-2024-36401 Critical
- CVE-2024-34696 Moderate
- CVE-2024-24749 Moderate
The details of this vulnerability will be made available at the end of the month providing an opportunity to update.
The use of the CVE system allows the GeoServer team to reach a wider audience than blog posts. See project security policy for more information on how security vulnerabilities are managed.
Demo Requests page rewrittenThe Demo Request page has been rewritten to use JavaScript to issue POST examples. This provides a much better user experience:
- Show Result lists the response headers to be viewed along side the returned result (with an option for XML pretty printing).
- Show Result in a New Page is available to allow your browser to display the result.
The WCS Request Builder and WPS Request Builder demos now have the option to show their results in Demo Requests page. Combined these changes replace the previous practice of using an iframe popup, and have allowed the TestWfsPost servlet to be removed.
For more information please see the Demo requests in the User Guide.
Thanks to David Blasby (GeoCat) for these improvements, made on behalf of the GeoCat Live project.
- GEOS-11390 Replace TestWfsPost with Javascript Demo Page
New Feature:
- GEOS-11390 Replace TestWfsPost with Javascript Demo Page
Improvement:
- GEOS-11311 Show a full stack trace in the JVM stack dump panel
-
GEOS-11369 Additional authentication options for cascaded WMS WMTS data stores - GEOS-11400 About Page Layout and display of build information
- GEOS-11401 Introduce environmental variables for Module Status page
Bug:
- GEOS-7183 Demo request/wcs/wps pages incompatible with [HTTPS]
- GEOS-11202 CAS extension doesn’t use global “proxy base URL” setting for service ticket
- GEOS-11331 OAuth2 can throw a “ java.lang.RuntimeException: Never should reach this point”
- GEOS-11332 Renaming style with uppercase/downcase empty the sld file
- GEOS-11382 The interceptor “CiteComplianceHack” never gets invoked by the Dispatcher Servlet
- GEOS-11385 Demo Requests functionality does not honour ENV variable PROXY_BASE_URL
- GEOS-11416 GeoPackage output contains invalid field types when exporting content from PostGIS
- GEOS-11430 CiteComplianceHack not correctly parsing the context
Task:
- GEOS-11318 Upgrade postgresql from 42.6.0 to 42.7.2
- GEOS-11374 Upgrade Spring version from 5.3.33 to 5.3.34
- GEOS-11375 GSIP 224 - Individual contributor clarification
- GEOS-11393 Upgrade commons-io from 2.12.0 to 2.16.1
- GEOS-11395 Upgrade guava from 32.0.0 to 33.2.0
- GEOS-11397 App-Schema Includes fix Integration Tests
- GEOS-11402 Upgrade PostgreSQL driver from 42.7.2 to 42.7.3
- GEOS-11403 Upgrade commons-text from 1.10.0 to 1.12.0
- GEOS-11404 Upgrade commons-codec from 1.15 to 1.17.0
For the complete list see 2.24.4 release notes.
Community UpdatesCommunity module development:
- GEOS-11040 Could not get a ServiceInfo for service Features thus could not check if the service is enabled
- GEOS-11381 Error in OIDC plugin in combination with RoleService
- GEOS-11412 Remove reference to JDOM from JMS Cluster (as JDOM is no longer in use)
Community modules are shared as source code to encourage collaboration. If a topic being explored is of interest to you, please contact the module developer to offer assistance.
About GeoServer 2.24 SeriesAdditional information on GeoServer 2.24 series:
- GeoServer 2.24 User Manual
- Control remote HTTP requests sent by GeoTools/GeoServer
- State of GeoServer 2.24.1 (foss4g-asia presentation)
- Multiple CRS authority support, planetary CRS
- Extensive GeoServer Printing improvements
- Upgraded security policy
Release notes: ( 2.24.4 | 2.24.3 | 2.24.2 | 2.24.1 | 2.24.0 | 2.24-RC )
-
sur Mappery: Orchids festival
Publié: 17 June 2024, 11:00am CEST

Barry Ruderman from raremaps.com shared this map from the Orchids Festival in Kew Gardens.
MapsintheWild Orchids festival
-
sur GeoTools Team: GeoTools 30.4 released
Publié: 16 June 2024, 6:06pm CEST
GeoTools 30.4 released The GeoTools team is pleased to announce the release of the latest maintenance version of GeoTools 30.4: geotools-30.4-bin.zip geotools-30.4-doc.zip geotools-30.4-userguide.zip geotools-30.4-project.zip This release is also available from the OSGeo Maven Repository and is made in conjunction with GeoServer 2.24.4 and GeoWebCache -
sur Mappery: Marking off the Countries Visited
Publié: 16 June 2024, 11:00am CEST
Marc-Tobias spotted this camper van in Hamburg. It looks as if the owners are marking off the countries that they have visited in it.
MapsintheWild Marking off the Countries Visited
-
sur Mappery: France on the Ceiling
Publié: 15 June 2024, 11:00am CEST
Andy Piper spotted this great collage on a ceiling. He said “Hey there, just in Big Fernand (French hamburger restaurant) in London today – they have France on the ceiling! “
Good spot Andy!
MapsintheWild France on the Ceiling
-
sur Oslandia: New release for QField : 3.3 “Darién”
Publié: 14 June 2024, 3:10pm CEST
Oslandia is the main partner of OPENGIS.ch around QField. We are proud today to forward the announcement of the new QField release 3.3 “Darién”. This release introduces a brand new plugin framework that empowers users to customize and add completely new functionalities to their favourite field application.
The plugin framework comes with other new features and improvements for this release, detailed below.
Main highlights
One of the biggest feature additions of this version is a brand new drawing tool that allows users to sketch out important details over captured photos or annotate drawing templates. This was a highly requested feature, which is brought to all supported platforms (Android, iOS, Windows, macOS, and, of course, Linux) with the financial support of the Swiss QGIS user group.
Also landing in this version is support for copying and pasting vector features into and from the clipboard. This comes in handy in multiple ways, from providing a quick and easy way to transfer attributes from one feature to another through matching field names to pasting the details of a captured feature in the field into a third-party messenger, word editing, or email application. Copying and pasting features can be done through the feature form’s menu as well as long pressed over the map canvas. Moreover, a new feature-to-feature attributes transfer shortcut has also been added to the feature form’s menu. Appreciation to Switzerland, Canton of Lucerne, Environment and Energy for providing the funds for this feature.

The feature form continues to gain more functionalities; in this version, the feature form’s value map editor widget has gained a new toggle button interface that can help fasten data entry. The interface replaces the traditional combo box with a series of toggle buttons, lowering the number of taps required to pick a value. The German Archaeological Institut – KulturGutRetter sponsored this feature.
Other improvements in the feature form include support for value relation item grouping and respect for the vector layer attributes’ « reuse last entered value » setting.

Finally, additional features include support for image decoration overlay, a new interface to hop through cameras (front, back, and external devices) for the ‘non-native’ camera, the possibility to disable the 3-finger map rotation gesture, and much more.
User experience improvementsLong-time users of QField will notice the new version restyling of the information panels such as GNSS positioning, navigation, elevation profile, and sensor data. The information is now presented as an overlay sitting on top of the map canvas, which increases the map canvas’ visibility while also achieving better focus and clarity on the provided details. With this new version, all details, including altitude and distance to destination, respect user-configured project distance unit type.
The dashboard’s legend has also received some attention. You can now toggle the visibility of any layer via a quick tap on a new eye icon sitting in the legend tree itself. Similarly, legend groups can be expanded and collapsed directly for the tree. This also permits you to show or hide layers while digitizing a feature, something which was not possible until now. The development of these improvements was supported by Gispo and sponsored by the National Land Survey of Finland.
Plugin frameworkQField 3.3 introduces a brand new plugin framework using Qt’s powerful QML and JavaScript engine. With a few lines of code, plugins can be written to tweak QField’s behaviour and add new capabilities. Two types of plugins are possible: app-wide plugins as well as project-scoped plugins. To ensure maximum ease of deployment, plugin distribution has been made possible through QFieldCloud! Amsa provided the financial contribution that brought this project to life.

Our partner OPENGIS.ch will soon offer a webinar to discover how QField plugins can help your field (and business) workflows by allowing you to be even more efficient in the field.
Users interested in authoring plugins or better understanding the framework, can already visit the dedicated documentation page and a sample plugin implementation sporting a weather forecast integration.
A question concerning QField ? Interested in QField deployment ? Do not hesitate to contact Oslandia to discuss your project !
-
sur Sortie de QField 3.3 « Darién »
Publié: 14 June 2024, 3:05pm CEST par Vincent Picavet
Oslandia est le partenaire principal d’OPENGIS.ch pour QField. Nous sommes fiers aujourd’hui de relayer l’annonce de la nouvelle version 3.3 « Darién » de QField. Cette version introduit un tout nouveau framework de plugins qui permet aux utilisateurs de personnaliser et d’ajouter des fonctionnalités complètement nouvelles à leur application de terrain préférée.
Le framework de plugins est accompagné d’autres nouvelles fonctionnalités et améliorations pour cette version, détaillées ci-dessous.
Les points marquants
L’une des plus grandes nouveautés de cette version est un tout nouvel outil de dessin qui permet aux utilisateurs d’annoter des détails importants sur des photos capturées ou de prendre des notes sur des modèles de dessin. Cette fonctionnalité, très demandée, est désormais disponible sur toutes les plateformes prises en charge (Android, iOS, Windows, macOS et, bien sûr, Linux) grâce au soutien financier du groupe d’utilisateurs QGIS suisse.
Cette version inclut également la prise en charge du copier-coller de features vectorielles dans et depuis le presse-papiers. Cela est utile de plusieurs manières, offrant un moyen rapide et facile de transférer des attributs d’une fonctionnalité à une autre via des noms de champs correspondants ou de coller les détails d’une fonctionnalité capturée sur le terrain dans une application de messagerie tierce, de traitement de texte ou de courrier électronique. Le copier-coller de features peuvent se faire via le menu du formulaire des features, ainsi que par un appui long sur la carte. De plus, un nouveau raccourci de transfert d’attributs de feature à feature a également été ajouté au menu du formulaire de feature. Remerciements au canton Suisse de Lucerne, Environnement et Énergie pour le financement de cette fonctionnalité.
Also landing in this version is support for copying and pasting vector features into and from the clipboard. This comes in handy in multiple ways, from providing a quick and easy way to transfer attributes from one feature to another through matching field names to pasting the details of a captured feature in the field into a third-party messenger, word editing, or email application. Copying and pasting features can be done through the feature form’s menu as well as long pressed over the map canvas. Moreover, a new feature-to-feature attributes transfer shortcut has also been added to the feature form’s menu. Appreciation to Switzerland, Canton of Lucerne, Environment and Energy for providing the funds for this feature.
Le formulaire de feature continue de gagner en fonctionnalités ; dans cette version, le widget de l’éditeur de carte de valeurs du formulaire de features a gagné une nouvelle interface de bouton qui peut accélère la saisie des données. L’interface remplace la boîte combo traditionnelle par une série de boutons-bascule, réduisant le nombre de clics nécessaires pour choisir une valeur. L’Institut archéologique allemand – KulturGutRetter a parrainé cette fonctionnalité.
D’autres améliorations du formulaire de fonctionnalité incluent la prise en charge du regroupement des éléments de relation de valeurs et le respect du paramètre « réutiliser la dernière valeur entrée » des attributs de la couche vectorielle.
Enfin, des fonctionnalités supplémentaires incluent la prise en charge de la superposition de décorations d’images, une nouvelle interface pour basculer entre les caméras (avant, arrière et dispositifs externes) pour la caméra « non native », la possibilité de désactiver le geste de rotation de la carte à trois doigts, et bien plus encore.
Améliorations d’interface utilisateur
Les utilisateurs de longue date de QField remarqueront le nouveau style des panneaux d’information tels que le positionnement GNSS, la navigation, le profil d’élévation et les données des capteurs. Les informations sont désormais présentées sous forme de superposition sur la carte, ce qui augmente la visibilité de la carte tout en améliorant la mise en avant et la clarté des détails fournis. Avec cette nouvelle version, tous les détails, y compris l’altitude et la distance jusqu’à la destination, respectent le type d’unité de distance configuré par l’utilisateur dans le projet.
La légende du tableau de bord a également reçu de l’attention. Vous pouvez désormais basculer la visibilité de n’importe quelle couche via un simple clic sur une nouvelle icône en forme d’œil située dans l’arbre de la légende. De même, les groupes de légendes peuvent être développés et réduits directement dans l’arbre. Cela vous permet également de montrer ou de masquer des couches tout en numérisant une fonctionnalité, ce qui n’était pas possible jusqu’à présent. Le développement de ces améliorations a été soutenu par Gispo et parrainé par le Service national du cadastre de Finlande.
The dashboard’s legend has also received some attention. You can now toggle the visibility of any layer via a quick tap on a new eye icon sitting in the legend tree itself. Similarly, legend groups can be expanded and collapsed directly for the tree. This also permits you to show or hide layers while digitizing a feature, something which was not possible until now. The development of these improvements was supported by Gispo and sponsored by the National Land Survey of Finland.
Framework de plugins
QField 3.3 introduit un tout nouveau framework de plugins utilisant le puissant moteur QML et JavaScript de Qt. Avec quelques lignes de code, des plugins peuvent être écrits pour ajuster le comportement de QField et ajouter de nouvelles fonctionnalités. Deux types de plugins sont possibles : des plugins au niveau de l’application ainsi que des plugins spécifiques au projet. Pour assurer une facilité maximale de déploiement, la distribution des plugins a été rendue possible via QFieldCloud ! Amsa a fourni la contribution financière qui a permis de réaliser ce projet.
Notre partenaire OPENGIS.ch proposera bientôt un webinaire pour découvrir comment les plugins QField peuvent améliorer vos workflows de terrain (et votre activité au sens large) en vous permettant d’être encore plus efficace sur le terrain.
Les utilisateurs intéressés par la création de plugins ou une meilleure compréhension du framework peuvent déjà visiter la page de documentation dédiée et un exemple d’implémentation de plugin intégrant une prévision météorologique.
Vous avez des questions sur QField ? Intéressés par sa mise en œuvre, n’hésitez pas à contacter Oslandia !
-
sur Mappery: Babelroth anno 1776
Publié: 14 June 2024, 11:00am CEST
Ekki Plicht sent us this pic from Babelroth in Germany
“Here is a nice mural which can be seen in the village of Barbelroth in
Germany. It is mounted on the wall at the corner of Hauptstraße and
Mühlstraße, and it is already mapped in OSM, object. [https:]]Cheers.
Ekki”MapsintheWild Babelroth anno 1776
-
sur QGIS Blog: QGIS Grant Programme 2024 Update no. 2
Publié: 14 June 2024, 8:30am CEST
Thanks to generous supporters, we are in the wonderful position to be able to announce that another project is successfully funded:
Our thanks go out to:
- Gis3W
- QTIBIA Engineering and QCooperative
- QGIS User Group Germany (QGIS Anwendergruppe Deutschland e.V.)
- Hytech-imaging spectral imaging for environmental mapping and monitoring in civil and defence applications
for providing the additional funding to top up the QGIS Grant Programme contribution for QEP#248.
The next proposals on the wait list are:
- QEP#294 Fix access to remote data sources in WebAssembly builds
- QEP#265 Use pre-commit to automate installation and management of all pre-commit hooks
- QEP#295 Embedded end-user feedback
If you want to help make these improvement a reality, please get in touch.
-
sur [1’Tech by Oslandia] télétravail
Publié: 14 June 2024, 6:48am CEST par Caroline Chanlon
On sort un peu de la minute Tech pour évoquer un « mot » qui nous implique particulièrement chez Oslandia. Alors essayons de donner notre meilleure définition du télétravail !
Le télétravail est une méthode de travail s’affranchissant de la proximité géographique des collaborateurs.
Quels avantages au télétravail ?- la fin des temps de trajet domicile-travail : un meilleur confort personnel, un bilan carbone fortement réduit
- une flexibilité accrue dans la gestion de son temps et l’organisation au quotidien
- des recrutements plus libres et plus faciles
- une communication et des process organisationnels nécessairement structurés
- l’efficience du travail asynchrone
Le télétravail n’est pas un problème en soi, mais c’est souvent un catalyseur de problèmes : chaque difficulté rencontrée peut prendre beaucoup plus d’importance et de criticité en distanciel. Cela oblige à traiter les problèmes à la racine, et ne pas les mettre « sous le tapis » en se disant qu’on les résoudra à la machine à café ! Cela crée un environnement d’entreprise plus sain et plus égalitaire.
Oslandia baigne dans la culture OpenSource, où le développement logiciel s’effectue par nature de façon distribuée, mondiale, et à distance. Nous avons donc ainsi un fonctionnement interne cohérent avec l’objet de notre activité, et nous nous inspirons des fonctionnements des communautés opensource pour le fonctionnement de l’entreprise.
Les ingrédients clé d’un télétravail durable, efficient et agréable :- un travail qui a du sens, facteur de motivation
- des postes de travail au domicile adaptés et confortables
- l’accompagnement RH et psychosocial des collaborateurs
- des process de fonctionnement et de communication clairs et partagés
- la culture de l’écrit, et les outils adaptés
- des rendez-vous réguliers pour se rencontrer de visu
Oslandia fonctionne en 100% télétravail, et cela depuis sa création il y a 15 ans ! L’équipe est répartie dans la France entière, nos clients aussi, et même à l’international. Nous livrons de beaux projets par nos compétences techniques, mais aussi grâce à notre structure organisationnelle.
-
sur OPENGIS.ch: Django Full-Stack Engineer with DevOps Affinity – 80 – 100% (Remote)
Publié: 14 June 2024, 6:47am CEST
Location: Remote, preferably with at least 4h overlap to CEST office hours
Employment Type: Full-time (80-100%)

About OPENGIS.ch:
OPENGIS.ch is a team of Full-Stack GeoNinjas offering personalized open-source geodata solutions to Swiss and international clients. We are dedicated to using and developing open-source tools, providing flexibility, scalability, and future-proof solutions, and playing a key role in the free and open-source geospatial community. We pride ourselves on our agile and distributed nature, which allows us to have a motivated and multicultural team that supports each other in working together.
Job Description:
We are seeking a passionate and skilled Django Full-Stack Engineer with a strong affinity for DevOps to join our team. The ideal candidate will work primarily on QFieldCloud, our cutting-edge cloud-based solution that brings QGIS projects to the field. You will help develop and maintain the full stack of the QFieldCloud platform, ensuring high performance and stability and implementing new features.
Responsibilities:
- Develop, test, and maintain the QFieldCloud platform using Django, Python, PostgreSQL and other modern web technologies.
- Collaborate with cross-functional teams to define, design, and ship new features.
- Ensure the performance, quality, and responsiveness of the application.
- Identify and correct bottlenecks and fix bugs.
- Help maintain code quality, organization, and automation.
- Work closely with the DevOps team to manage and optimize deployment pipelines, including Docker, Kubernetes, and other containerization and orchestration technologies.
- Provide technical guidance and support to clients regarding deployment and usage of the platform.
Qualifications:
- Strong experience with Django and Python in a full-stack capacity.
- Proficiency in front-end technologies, including JavaScript, HTML5, and CSS3.
- Experience with Linux, Docker (compose), K8s, Git, and PostgreSQL.
- Familiarity with geospatial concepts and web GIS applications is a plus.
- Good understanding of software deployment, containerization, and continuous integration practices.
- Excellent problem-solving skills and ability to work independently.
- Strong communication skills and ability to work in a distributed team environment.
- Fluency in English; knowledge of German, French, Italian, Spanish, or Romansh is a plus.
Perks:
At OPENGIS.ch, we enjoy a variety of perks that make our work experience rewarding. Here’s what we get:
- Flexible Work Hours: We have the freedom to set our own schedules, which helps us better manage our personal and professional lives.
- Remote Work Opportunities: We can work from anywhere, giving us the flexibility to choose our work environment.
- Learning and Development: We are encouraged to grow professionally with access to training programs and workshops.
- Innovative Environment: We thrive in an atmosphere that’s at the forefront of GIS technology, which keeps our work exciting.
- Collaborative Team: We value teamwork and the exchange of ideas, making our workplace dynamic and supportive.
Questions for Applicants:
- What’s your experience with software deployment and containers?
- What is your favourite Django app? Why? Have you ever upstreamed a patch in Django or an app? if so, please provide a link to the pull request.
- What is the error in the featured image of this post?
- What did you last learn out of interest?
How to Apply:
If you are excited about this opportunity and meet the qualifications, please submit an application at opengis.ch/jobs
Join us at OPENGIS.ch and become a part of our mission to provide innovative open-source geospatial solutions!


-
sur Mappery: 17th C Antwerp Street Scene
Publié: 13 June 2024, 11:00am CEST

Reinder sent us this massive 17C repro of a street map of Antwerp on a hoarding. The info on the side says “art historians, developed especially for the festival and pastor of Sint-Andries, a city walk along many landmarks in the city.”
MapsintheWild 17th C Antwerp Street Scene
-
sur Eurométropole de Strasbourg : une plateforme facilitant le partage et la diffusion interne des données géographiques
Publié: 13 June 2024, 7:16am CEST par Caroline Chanlon
L’Eurométropole de Strasbourg a fait appel à Oslandia pour se doter d’une plateforme intranet de nouvelle génération facilitant le partage et la diffusion interne des données géographiques.
Ce projet bien que porté par un seul service est à destination de l’ensemble de la collectivité.
De nombreuses données géographiques produites par les géomaticiens n’étaient accessibles que par des clients lourds ayant une interface relativement complexe qui bridait leur utilisation aux personnes initiées.
De plus la publication des projets QGIS sur la plateforme web nécessitait plusieurs étapes de conversion et vérification.Le projet avait donc pour but de simplifier la publication et de populariser l’accès aux données géographiques du SIG au travers de la mise en œuvre d’outils simples d’utilisation, intuitifs, performants et Open Source.
De plus afin de respecter les normes de sécurité de l’Eurométropole et d’être transparent pour les utilisateurs, la solution recherchée doit être compatible avec le système d’authentification et de gestion de droits de la collectivité.
Nous avons répondu à cette demande en utilisant et interfaçant plusieurs briques Open Source : QGIS Server, QGIS Web Client 2 (QWC2), Geonetwork, Map proxy et Keycloak.
Cyle de vie de la donnée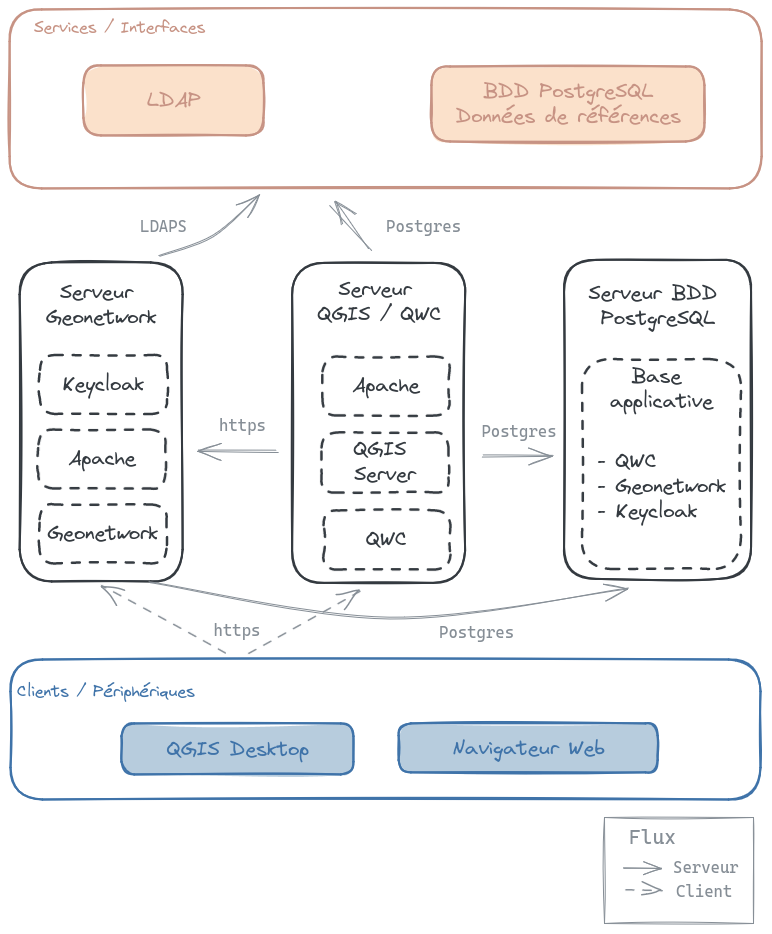
Le besoin initial de l’Eurométropole était d’avoir un cycle de vie complet allant de la création à la diffusion en passant par le référencement de leurs données géographiques.
Tout d’abord, les données sont créées depuis le logiciel QGIS Desktop dans une base de données PostgreSQL/PostGIS.
Pour chaque groupe de données thématique, il est nécessaire de produire une fiche de métadonnée dans le géocataloque de l’EMS (Geonetwork), un fichier .qlr afin de pouvoir charger ces données de manière simple dans QGIS Desktop, un projet qgis pour la diffusion dans la plateforme web (QGIS Server/QWC2).
Connexion et sécurité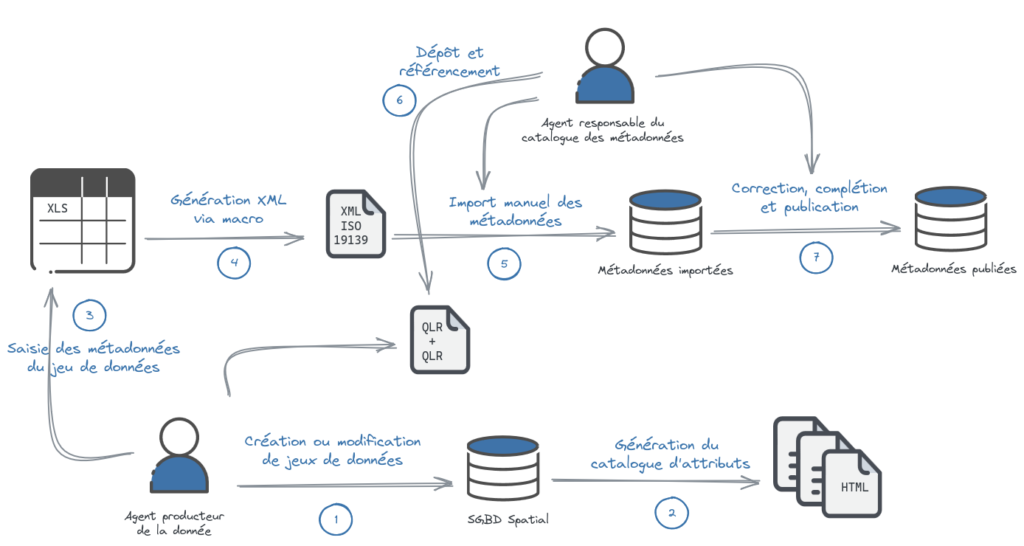
Afin de gérer les droits d’accès aux données ainsi qu’aux applications, l’EMS possède un SSO Kerberos basé sur un annuaire AD.
Durant l’ensemble du projet, la sécurité a été un point majeur afin que ce SSO puisse être intégré dans chaque étapes du cycle de vie de la donnée.
Tout d’abord l’ensemble des groupes de la base PostgreSQL sont synchronisés avec l’annuaire AD, afin de sécuriser l’accès direct à la donnée.
Ensuite, pour sécuriser la diffusion, un plugin QGIS Server initialement développé par l’EMS a été repris dans le cadre de ce projet. Les droits définis en base de données (et donc dans l’AD) sont pris en compte pour autoriser ou non la lecture des données et leur affichage sur la plateforme Web selon l’utilisateur connecté.
Finalement, pour l’accès aux applications, une brique KeyCloak a été installée, elle est moins visuelle mais essentielle. Elle permet de ce connecter au SSO Kerberos et de fournir un protocole OpenIDC compatible nativement avec Geonetwork. Pour la plateforme QWC2, un micro-service spécifique a été développé afin de pouvoir récupérer l’authentification fournie par le module OpenIDC d’Apache.
La diffusion des projets : QGIS Server / MapproxyQgis Server permet de diffuser sous forme de flux OGC les projets préalablement créés dans QGIS. Il peut en effet servir les projets avec un rendu de style identique à celui paramétré dans QGIS, ces deux logiciels utilisant le même moteur cartographique. Les projets QGIS déjà existants n’ont eu besoin que de changements mineurs pour pouvoir être servis par QGIS Server et obtenir le même rendu que celui obtenu dans QGIS Desktop.
Certains fonds de plan sont très utilisés et par définition assez lourd au chargement. Pour une meilleure expérience utilisateur, surtout sur un navigateur web, il ne faut pas que la carte mette trop longtemps à charger. C’est pour cela que MapProxy a été mis en place, pour optimiser le chargement de ces fonds de plan en créant un cache paramétré sur plusieurs niveaux de zoom.
Le visualisateur cartographique web : QGIS Web Client 2QGIS Web Client 2 ou QWC2 est le visualisateur web officiel de QGIS. Il est Open Source et maintenu par la communauté QGIS.
QWC2 a été installé et personnalisé pour correspondre aux besoins du projet. Plusieurs micro-services ont été utilisés et adaptées, notamment l’extension d’administration permettant ainsi à l’EMS d’être autonome dans la publication de nouveaux thèmes (projet QGIS) ou la modification d’existant en les paramétrant à souhait. En effet on peut pour un thème choisir le nom, la vignette miniature pour repésenter le thème, les fonds de plans disponibles mais également les échelles de zoom ou les échelles d’impression de carte ou le type de recherche qui s’active dans la barre de recherche.
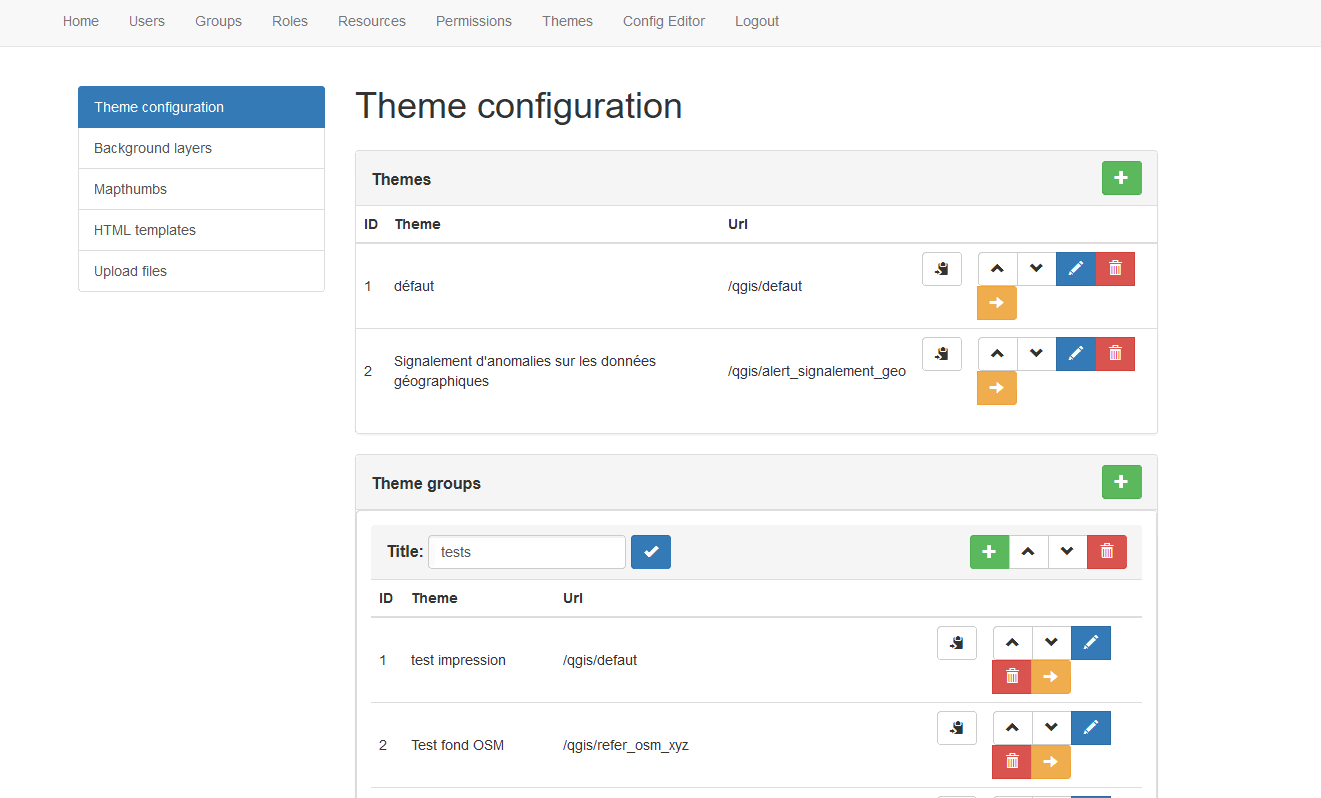
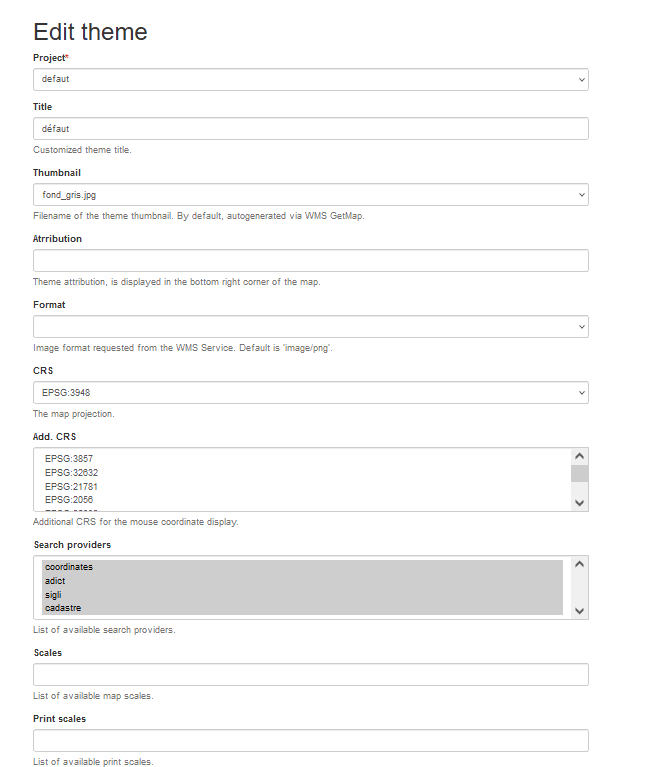
En effet pour l’EMS nous avons configuré plusieurs recherches :
- Recherche dans la BAN (Base Nationale Adresse) personnalisée de l’EMS
- Recherche Cadastral (commune, section, parcelle)
- Recherche dans le géocatalogue GéoNetwork (pour charger les couches ou consulter le catalogue)
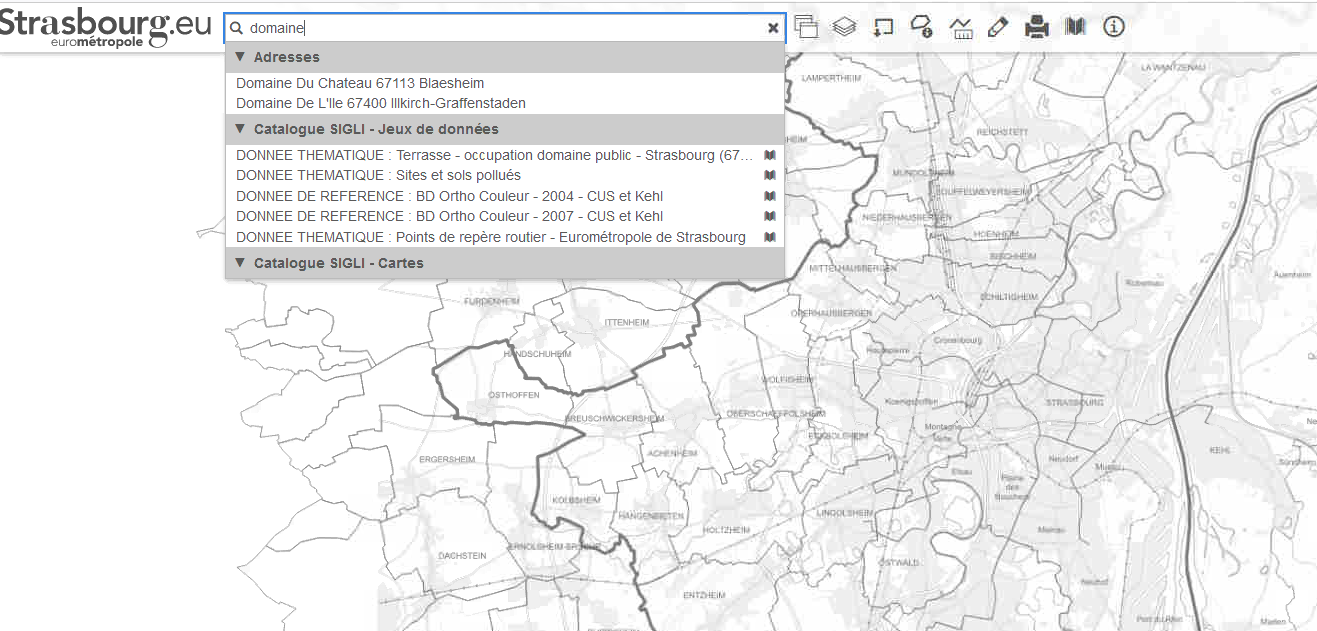
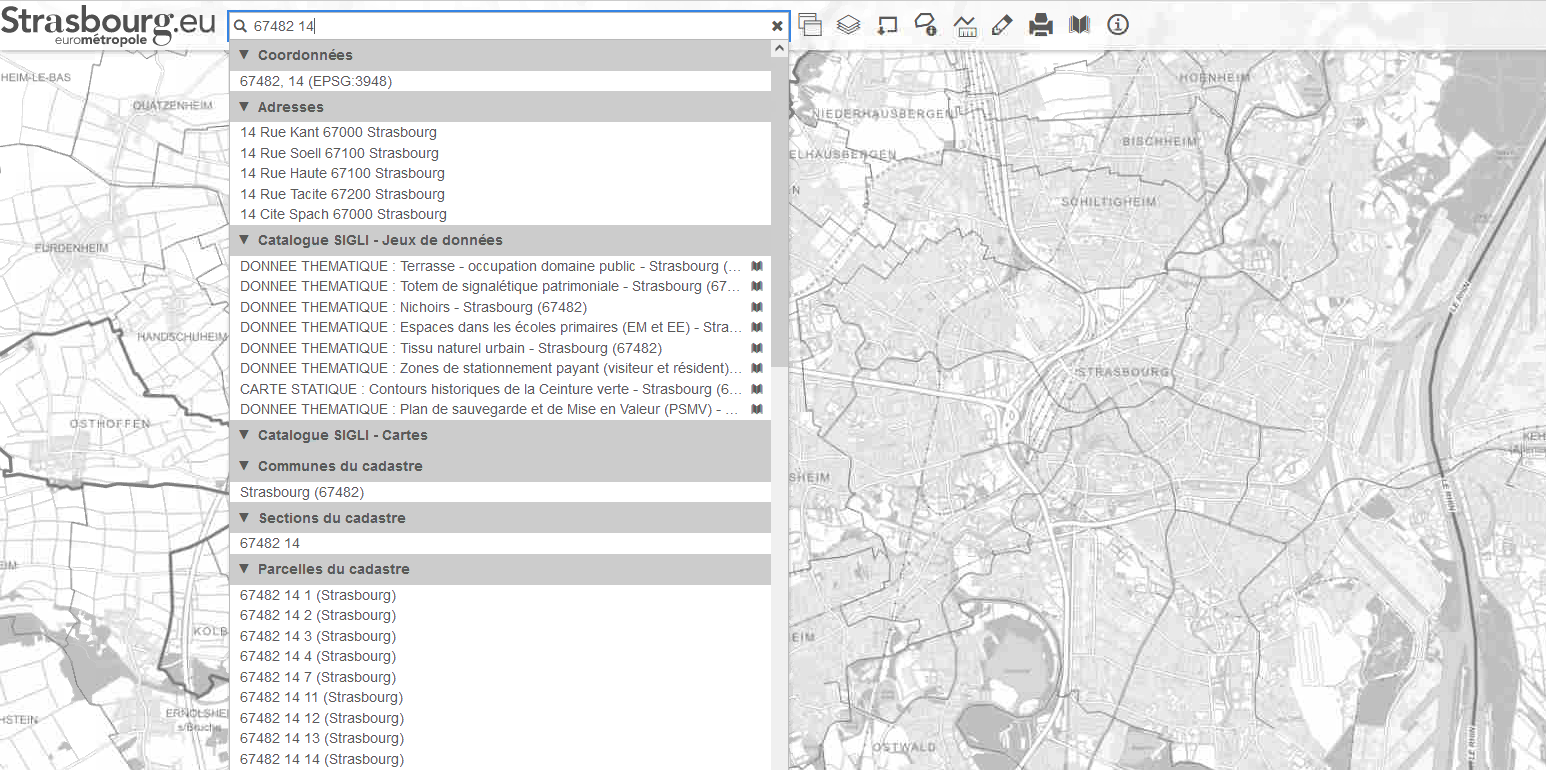
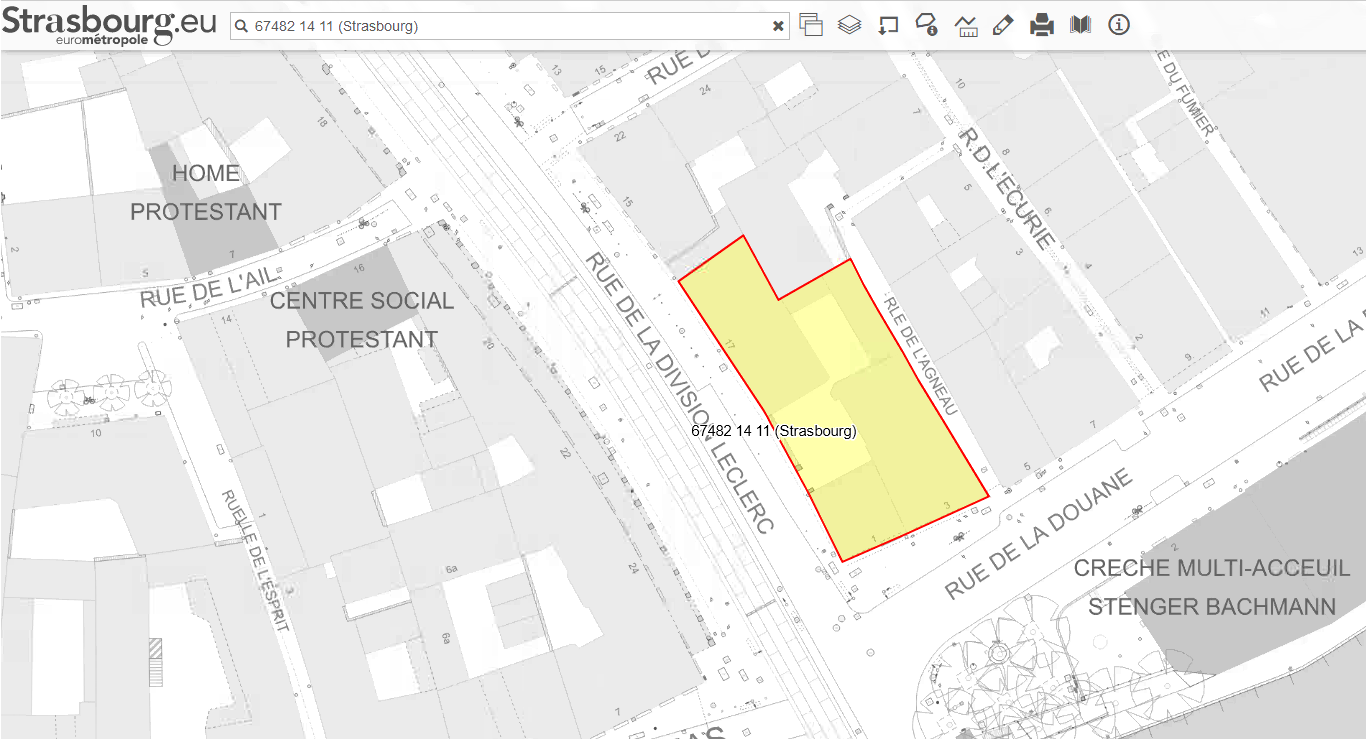
Cette interface d’administration permet également à l’EMS d’organiser les différents thèmes en groupes pour correspondre aux thématiques des données ou à un classement par équipe de travail; et de rendre accessible de nouveaux fonds de plan.
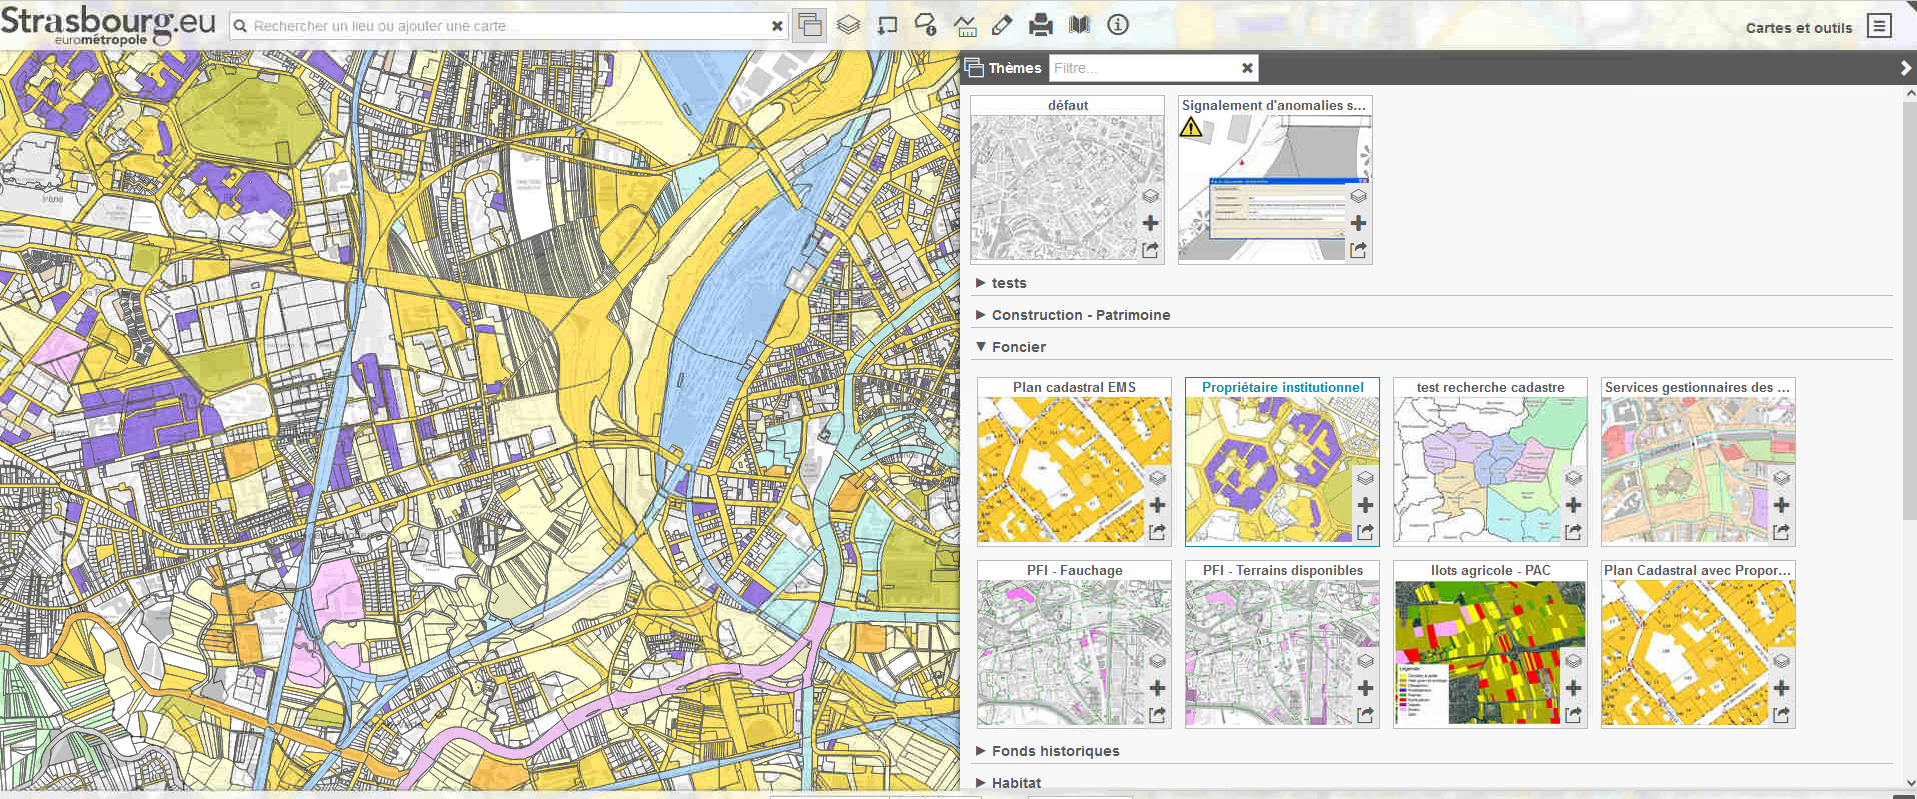
Dans certains projets QGIS, des composeurs d’impression sont disponibles. Ces composeurs sont également disponibles dans l’interface Web QWC2 avec des champs personnalisables au moment de l’impression, comme le titre de la carte par exemple.
Les cartes chargées dans QWC2 ne sont pas figées. En effet l’utilisateur peut personnaliser son visuel de plusieurs manières :
- Modifier le fond de plan chargé par défaut
- Cocher et décocher des couches comme dans QGIS
- Charger quelques couches ou la totalité des couches en provenance d’un autre projet
- Ajouter des couches en provenance du GeoNetwork EMS grâce à un développement spécifique Oslandia
- Ajouter des couches en provenance d’un web service externe ou un fichier local de son ordinateur
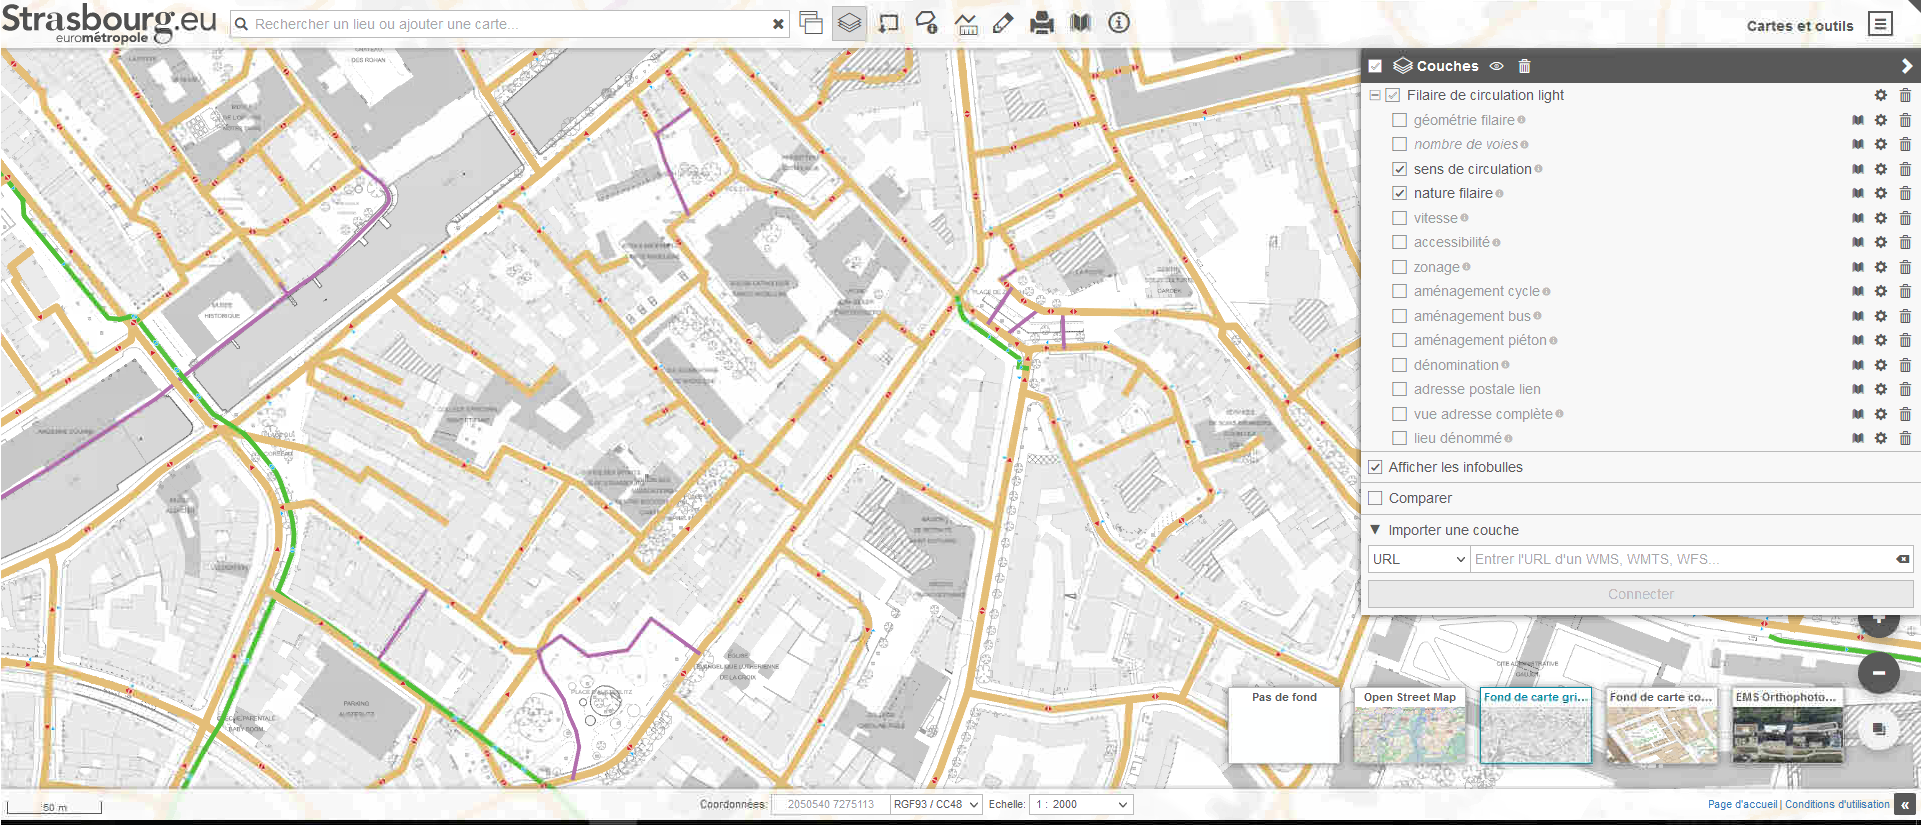
Les utilisateurs ont également la possibilité de “dessiner” sur la carte ou d’ajouter des étiquettes pour compléter les informations ou prendre des notes rapidement.
Toutes ces annotations sont enregistrables via un marque-page et partageables en générant et conservant un permalien.
Le catalogue de données géographiques : GeonetworkLe géocatalogue de l’EMS a été paramétré et modifié afin de répondre à leur besoin. En effet, Geonetwork possède une interface cartographique par défaut. Afin d’intégrer complètement le géocataloque dans le projet, cette interface à été remplacé par la plateforme web QWC2.
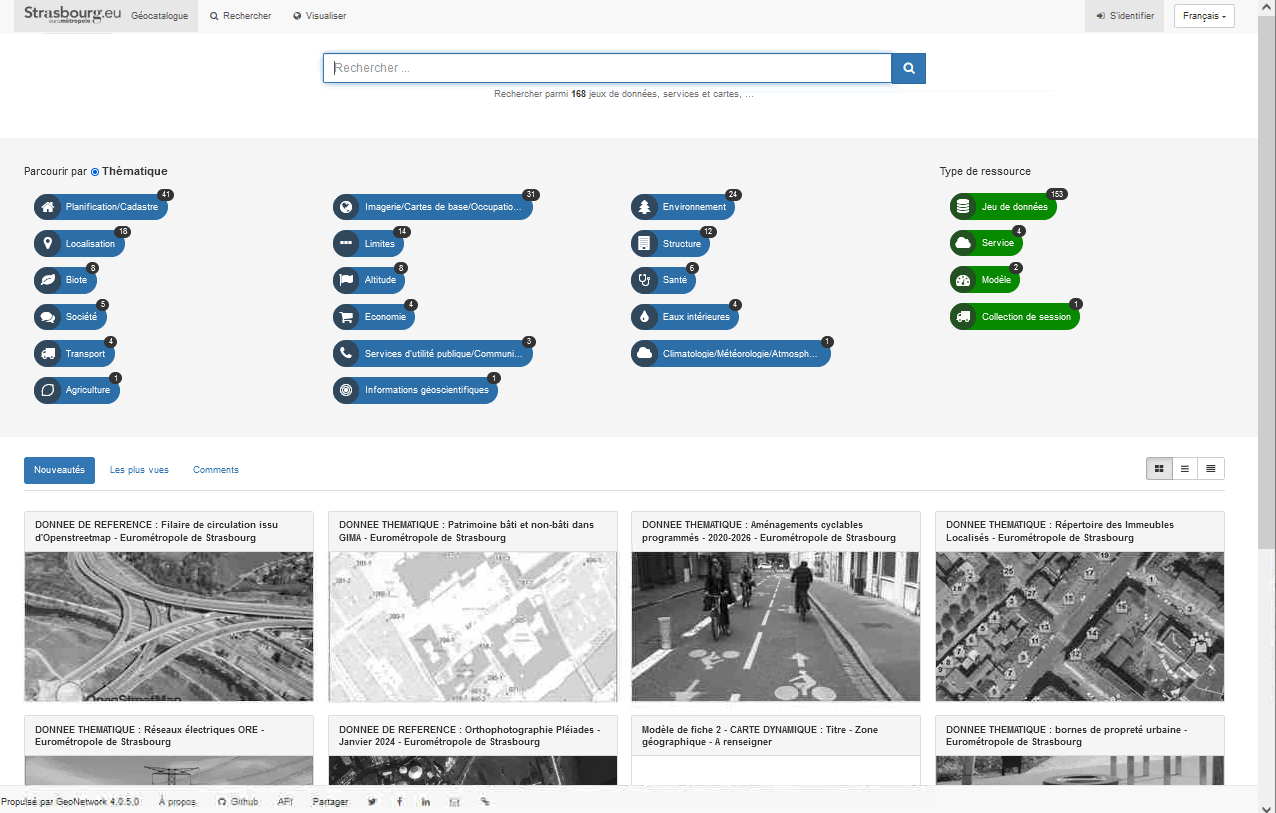
Ce couplage avec QWC2 permet également de faciliter l’ajout des couches du Géocatalogue à une carte déjà ouverte dans la visionneuse.
Contributions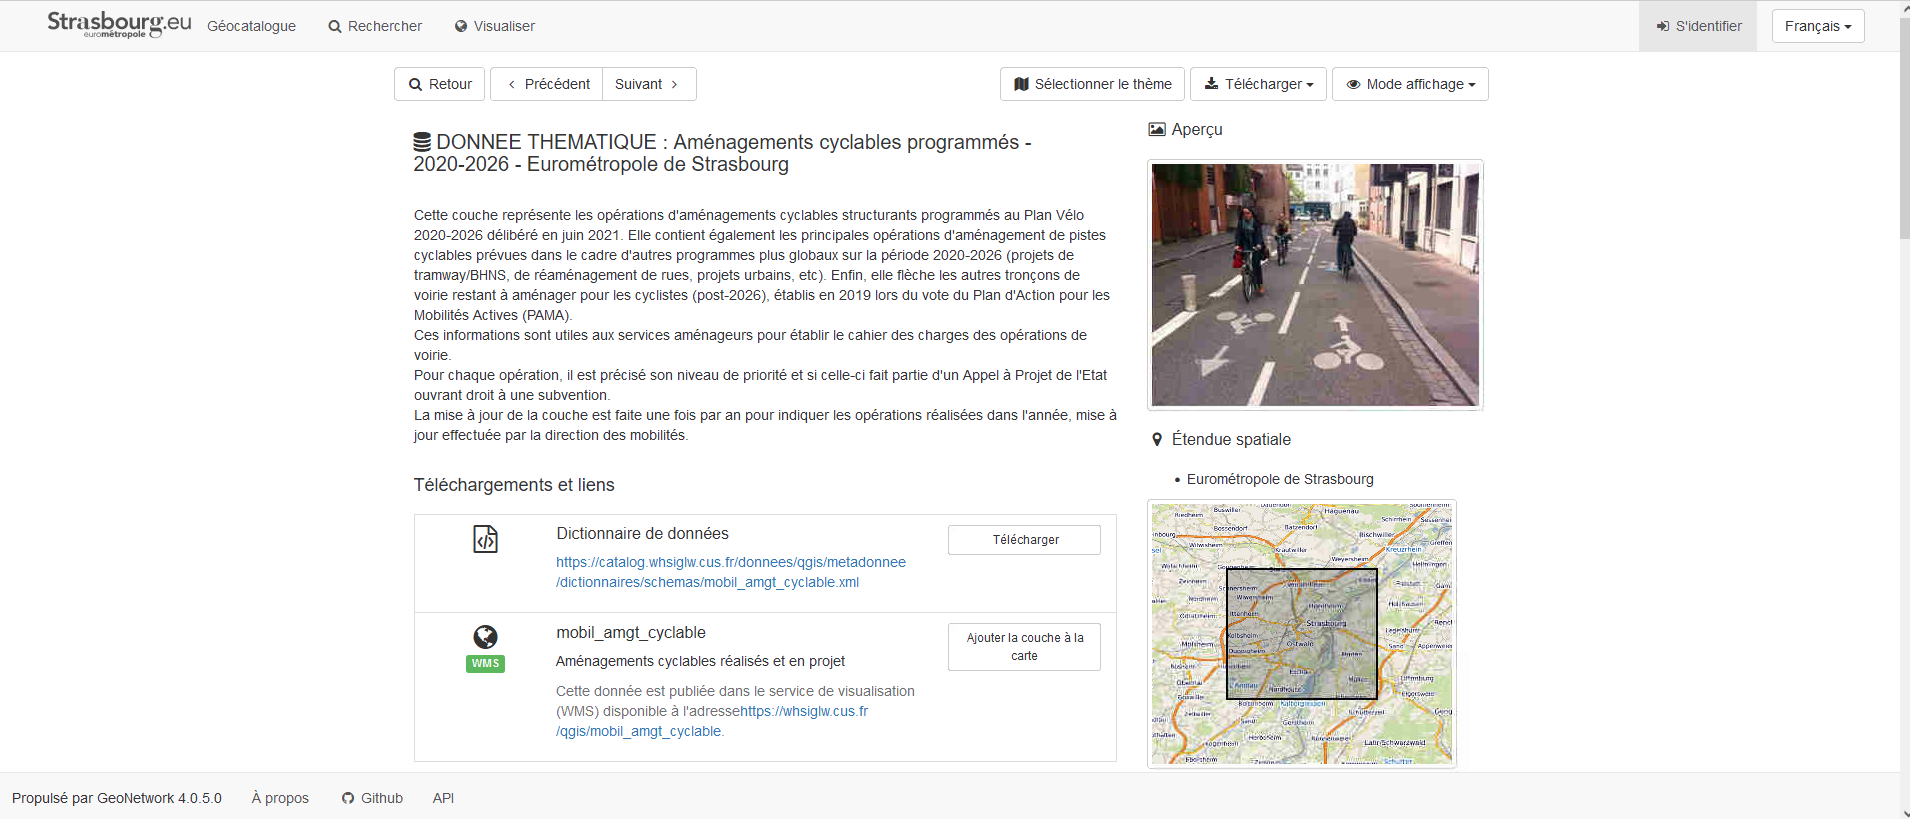
Durant cette prestation toutes les évolutions/correctifs qui n’étaient pas spécifiques à l’EMS ont été reversées à la communauté (25 Pull Request et 6 composants modifiés). Travailler avec nous c’est également travailler pour la communauté QGIS.
L’EMS a même eu envie de participer à l’effort collectif en se lançant dans la contribution opensource et réalisé certaines contributions pendant le projet :
- Ajout du support XYZ dans l’interface d’admin
- Ajout de l’option pour paramétrer l’infobulle activé par défaut dans l’ajout de projet depuis l’interface d’administrace.
- Ajout de l’option dans l’interface d’administration pour choisir si l’on veut que le rendu sur notre projet s’effectue de manière tuilé ou non.
- Ajout du support de la gestion du type Enum de postgres dans la génération des formulaires
Si la description de ce projet vous a donné des idées, n’hésitez pas à nous contacter, nous pourrons parler avec vous de vos projets.
-
sur Camptocamp: 3D Technology Serving Rennes Métropole's Solar Cadastre
Publié: 13 June 2024, 2:00am CEST
Pièce jointe: [télécharger]
Camptocamp put its expertise to work for the city, by developing a totally customized application, based on an extremely clear user experience. -
sur Camptocamp: 3D Technology Serving Rennes Métropole's Solar Cadastre
Publié: 13 June 2024, 2:00am CEST
Camptocamp put its expertise to work for the city, by developing a totally customized application, based on an extremely clear user experience. -
sur GeoServer Team: GeoServer 2.23.6 Release
Publié: 13 June 2024, 2:00am CEST
GeoServer 2.23.6 release is now available with downloads (bin, war, windows), along with docs and extensions.
This series has previously reached end-of-life, with this release issued to address an urgent bug or security vulnerability (see CVE-2024-36401 below).
This GeoServer 2.23.6 update is provided as a temporary measure. Rather plan to upgrade to a stable GeoServer 2.25.2 or maintenance GeoServer 2.24.4.
GeoServer 2.23.6 is made in conjunction with GeoTools 29.6, and GeoWebCache 1.23.5.
Thanks to Jody Garnett (GeoCat) for making this release on behalf of GeoCat customers.
Security ConsiderationsThis release addresses security vulnerabilities and is considered an essential update for production systems.
- CVE-2024-36401 Critical
- CVE-2024-24749 Moderate
The details of this vulnerability will be made available at the end of the month providing an opportunity to update.
See project security policy for more information on how security vulnerabilities are managed.
Release notesImprovement:
- GEOS-11327 Add warning about using embedded data directories
- GEOS-11347 STAC Landing Page links should include root link
Bug:
- GEOS-11331 OAuth2 can throw a “java.lang.RuntimeException: Never should reach this point”
Task:
- GEOS-11316 Update Spring version to 5.3.32
- GEOS-11318 Upgrade postgresql from 42.6.0 to 42.7.2
For the complete list see 2.23.6 release notes.
Community UpdatesCommunity module development:
- GEOS-11348 JMS cluster does not allow to publish style via REST “2 step” approach
- GEOS-11358 Feature-Autopopulate Update operation does not apply the Update Element filter
- GEOS-11381 Error in OIDC plugin in combination with RoleService
- GEOS-11412 Remove reference to JDOM from JMS Cluster (as JDOM is no longer in use)
Community modules are shared as source code to encourage collaboration. If a topic being explored is of interest to you, please contact the module developer to offer assistance.
About GeoServer 2.23 SeriesAdditional information on GeoServer 2.23 series:
- GeoServer 2.23 User Manual
- Drop Java 8
- GUI CSS Cleanup
- Add the possibility to use fixed values in Capabilities for Dimension metadata
- State of GeoServer 2.23
- GeoServer Feature Frenzy 2023
- GeoServer used in fun and interesting ways
- GeoServer Orientation
Release notes: ( 2.23.6 | 2.23.5 | 2.23.4 | 2.23.3 | 2.23.2 | 2.23.1 | 2.23.0 | 2.23-RC1 )
-
sur Camptocamp: 3D Technology Serving Rennes Métropole's Solar Cadastre
Publié: 13 June 2024, 2:00am CEST
Pièce jointe: [télécharger]
Camptocamp put its expertise to work for the city, by developing a totally customized application, based on an extremely clear user experience. -
sur Mappery: Anne Hathaway’s Garden
Publié: 12 June 2024, 11:00am CEST
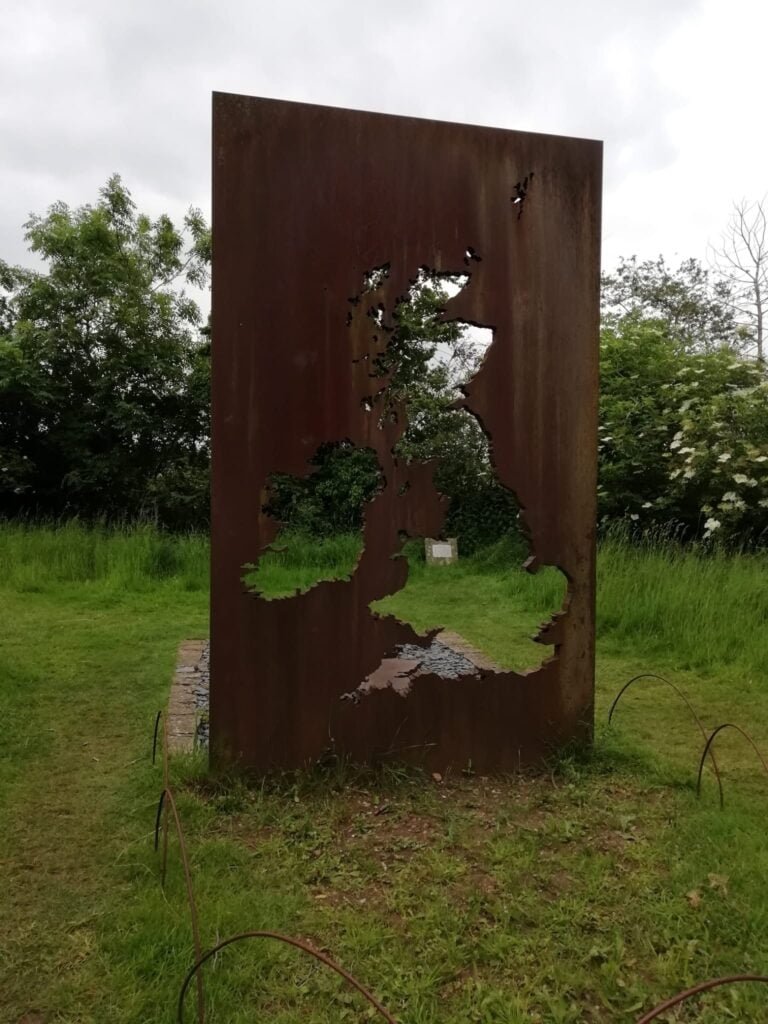
Berl spotted this map sculpture he found in the grounds of Ann Hathaway’s cottage just outside Stratford-on-Avon. It is described as:
A sculpture inspired by Shakespeare’s history plays, designed for Anne Hathaway’s Cottage Tree Garden. The sculptor is Jane Lawrence.
Not sure how this connects to the history plays with no towns depicted?
MapsintheWild Anne Hathaway’s Garden
-
sur Mappery: A Wild Map in Spitalfields
Publié: 11 June 2024, 11:00am CEST
Elizabeth spotted this cool looking bike in Spitalfields market in London
MapsintheWild A Wild Map in Spitalfields